Question #4, the highlighted is incorrect
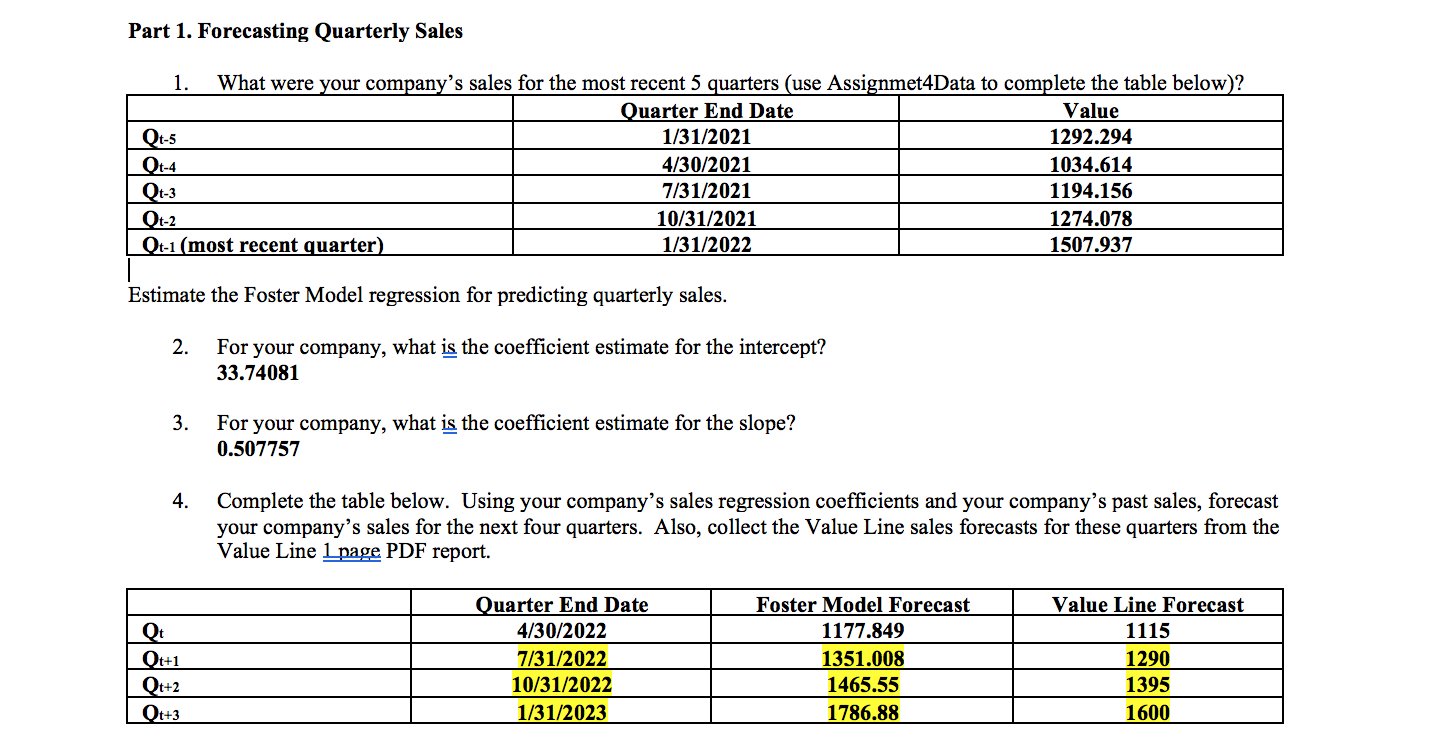
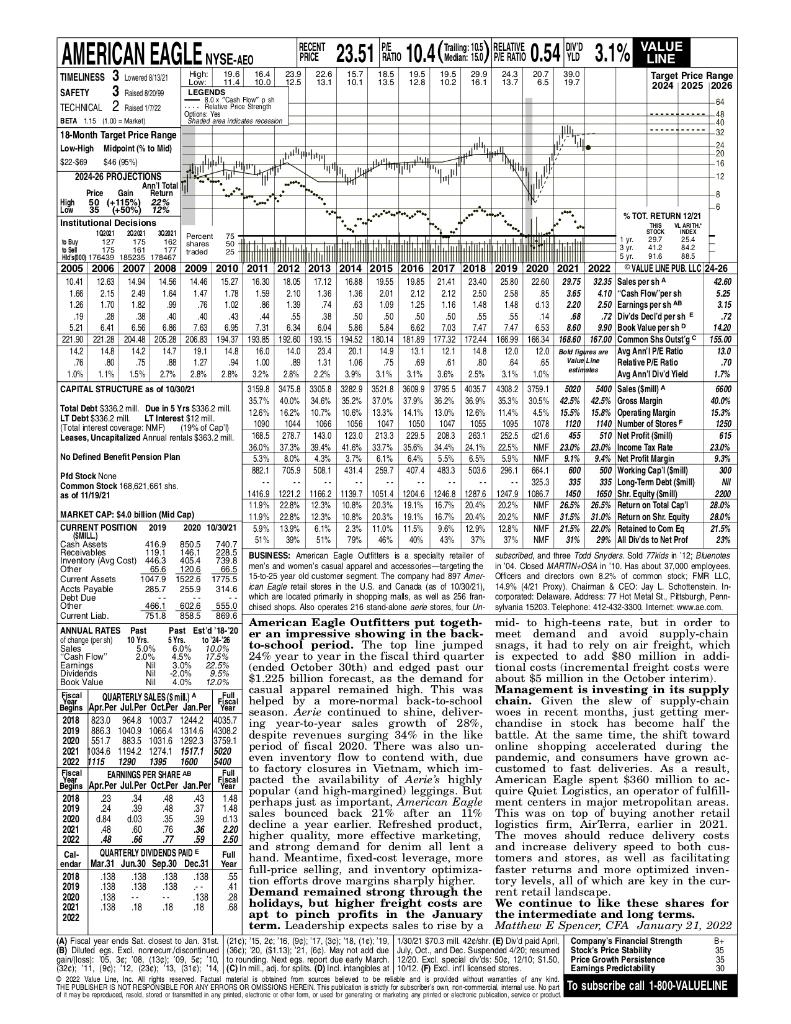
Part 1. Forecasting Quarterly Sales 1. What were your company's sales for the most recent 5 quarters (use Assignmet4Data to complete the table below)? Quarter End Date Value Qt-5 1/31/2021 1292.294 Qt-4 4/30/2021 1034.614 Qt-3 7/31/2021 1194.156 Qt-2 10/31/2021 1274.078 1507.937 Qt-1 (most recent quarter) 1/31/2022 Estimate the Foster Model regression for predicting quarterly sales. 2. For your company, what is the coefficient estimate for the intercept? 33.74081 3. For your company, what is the coefficient estimate for the slope? 0.507757 4. Complete the table below. Using your company's sales regression coefficients and your company's past sales, forecast your company's sales for the next four quarters. Also, collect the Value Line sales forecasts for these quarters from the Value Line Lpage PDF report. Quarter End Date Foster Model Forecast 1177.849 Value Line Forecast 1115 Qt 4/30/2022 Qt+1 7/31/2022 1351.008 1290 Qt+2 10/31/2022 1465.55 1395 Qt+3 1/31/2023 1786.88 1600 RECENT PRICE 23.9 22.6 12.5 13.1 AMERICAN EAGLE NYSE-AEO TIMELINESS 3 Lowered 8/13/21 High: 19.6 16.4 Low: 11.4 10.0 LEGENDS -BOX "Cash Flow ... Helative Price Strength Options Ves SAFETY 3 Raised 8/20/99 TECHNICAL 2 Raised 1/7/22 BETA 1.15 11.00 = Market) 18-Month Target Price Range Low-High Midpoint (% to Mid) Shaded area indicates recession $22-$69 $46 (95%) bibally Ann'l Total 2024-26 PROJECTIONS Price Gain Return High 50 (+115%) 22% Low (+50%) 12% 35 (+50%) Institutional Decisions % TOT. RETURN 12/21 T THIS VL ARITH. 30211 Percent STOCK INDEX 102021 20201 302021 127 75 50 29.7 Buy 25.4 162 shares 177 vaded 1 yr. 3 yr. 175 175 161 T 41.2 to 84.2 Sel 25 Hld s00176439 185235 178467 5 yr. 91.6 88.5 2022 VALUE LINE PUB. LLC 24-26 2005 2006 2007 2008 2009 10.41 12.63 14.94 14.56 14.46 15.27 1.68 2.15 2.49 1.64 1.47 1.78 32.35 Sales per sh 42.60 4.10 "Cash Flow per sh 5.25 2010 2011 2012 2013 2014 2015 2016 2017 2018 2019 2020 2021 16.30 18.05 17.12 16.88 19.55 19.85 21.41 23.40 25.80 22.60 29.75 1.59 2.10 1.36 1.36 2.01 2.12 2.12 2.50 2.58 85 3.65 .86 1.39 74 63 1.09 1.25 1.16 1.48 1.48 d.13 2.20 44 55 38 50 50 50 50 55 55 14 .68 6.04 5.86 5.84 6.62 7.03 7.47 7.47 6.53 8.60 1.26 1.70 1.82 .99 .76 1.02 2.50 Earnings per sh An 3.15 19 28 38 40 40 72 Div'ds Decl'd per sh E .72 43 6.86 7.63 6.95 7.31 5.21 6.41 6.56 6.34 9.90 Book Value per sh 14.20 155.00 13.0 .70 1.7% 6600 40.0% Bold figures are Avg Ann'l P/E Ratio Value Line Relative P/E Ratio estimates Avg Ann'l Div'd Yield 5400 Sales (Smill) 42.5% Gross Margin 15.8% Operating Margin 1140 Number of Stores F 510 Net Profit (Smil) 23.0% Income Tax Rate 9.4% Net Profit Margin 15.3% Total Debt $336,2 mill. Due in 5 Yrs $336 2 mill LT Debt $336.2 mill LT Interest $12 mil. (Total interest coverage: NMF) (19% of Cap') Leases, Uncapitalized Annual rentals $363.2 mill 1250 213.3 615 41.8% 33.7% 41.6% 33.7% 23.0% No Defined Benefit Pension Plan 36.0% 37.3% 39.4% 5.3% 8.0% 4.3% 882.1 705.9 508.1 229.5 35.6% 35.6% 6.4 % 407.4 9.3% 3.7% 6.1 % 431.4 259.7 500 Working Cap'l (Smill) 300 Pid Stock None .. .. .. MI .. Common Stock 168,621,661 shs. as of 11/19/21 2200 MARKET CAP: $4.0 billion (Mid Cap) 28.0% 28.0% 21.5% 23% CURRENT POSITION 2019 2020 10/30/21 (SMILL.) 221.90 221.28 204.48 205.28 206.83 194.37 193.85 192.60 193.15 194.52 180.14 181.89 177.32 172.44 166.99 166.34 168.60 167.00 Common Shs Outst'g 14.2 14.8 142 14.7 19.1 14.8 16.0 14.0 23.4 20.1 14.9 13.1 12.1 14.8 12.0 12.0 76 .80 75 88 1.27 94 1.00 .89 1.31 1.06 75 69 61 80 64 65 1.0% 1.1% 1.5% 2.7% 2.8% 2.8% 3.2% 2.8% 2.2% 3.9% 31% 3.1% 3.6% 2.5% 3.1% 1.0% CAPITAL STRUCTURE as of 10/30/21 3159.8 3475.83305.8 3282.9 3521.8 3609.9 3795.5 4035.7 4308.2 3759.1 5020 35.7% 40.0% 34.6% 35.2% 37.0% 37.9 % 36.2% 35.9% 35.3% 30.5% 42.5% 126 % 16.2% 10.7% 10.6 % 13.3% 14.1% 13.0 % 12.6% 11.4% 4.5% 15.5% 1090 1044 1066 1056 1047 1050 1047 1055 1095 1078 1120 168.5 278.7 143.0 123.0 208.3 263.1 252.5 d21.6 455 37.3% 39.4% 34.4% 24.1% 22,5% NMF 23.0% 5.5 % 6.5% 5.9 % NMF 9.1% 483.3 503.6 296.1 664.1 600 325.3 .. 335 335 Long-Term Debt (Smill) 1416.9 1221.2 1166.2 1139.7 1051.4 1204.6 1246.8 12876 1247.9 1086.7 1450 1650 Shr. Equity (Smill) 11.9% 22.8% 12.3% 10.8% 20.3% 19.1% 16.7% 20.4% 20.2% NMF 26.5% 26.5% Return on Total Cap'l 11.9% 22.8 % 12.3% 10.8% 20.3% 19.1% 16.7 % 20.4% 20.2% NMF 31.5% 31.0% Return on Shr. Equity 5.9% 13.9% 6.1% 2.3% 11.0% 11.5% 96% 12.9% 12.8% NMF 21.5% 22.0% Retained to Com Eq 51% 30% 51% 43% 37% 37% NMF 79% 46% 40% 31% 29% All Div'ds to Net Prof BUSINESS: American Eagle Outfitters is a specialty retailer of subscribed, and three Todd Snyders. Sold 77kids in 12; Bluenotes men's and women's casual apparel and accessories-targeting the in '04. Closed MARTIN-OSA in 10. Has about 37,000 employees. 15-to-25 year old customer segment. The company had 897 Amer- Officers and directors own 8.2% of common stock; FMR LLC, ican Eagle retail stores in the U.S. and Canada (as of 10/30/21), 14.9% (4/21 Proxy). Chairman & CEO: Jay L. Schottenstein. In- which are located primarily in shopping malls, as well as 256 fran- corporated: Delaware, Address: 77 Hot Metal St., Pittsburgh, Penn- chised shops. Also operates 216 stand-alone aerie stores, four Un- sylvania 15203. Telephone: 412-432-3300 Internet: www.ae.com. American Eagle Outfitters put togeth- mid- to high-teens rate, but in order to Past Est'd 18-20 er an impressive showing in the back- meet demand and avoid supply-chain snags, it had to rely on air freight, which is expected to add $80 million in addi- tional costs (incremental freight costs were about $5 million in the October interim). Management is investing in its supply chain. Given the slew of supply-chain woes in recent months, just getting mer- chandise in stock has become half the battle. At the same time, the shift toward online shopping accelerated during the pandemic, and consumers have grown ac- customed to fast deliveries. As a result, Cash Assets Receivables 416.9 119.1 850.5 740.7 146.1 228.5 446.3 Inventory (Avg Cost) Other Current Assets Accts Payable Debt Due Other 405 4 739.8 65.6 120.6 66.5 1047.9 1522.6 1775.5 285.7 255.9 314.6 1661 CON C 466.1 602.6 555.0 751.8 858.5 869.6 Past 10 Yrs. Current Liab. ANNUAL RATES of change (per sh) Sales "Cash Flow" Earnings Dividends Book Value 5.0% 2.0% Nil Nil 5 Yrs. 24-26 6.0% 10.0% 4.5% 17,5% 3.0% 22.5% -2.0% 9.5% Nil 4.0% 12.0% Fiscal QUARTERLY SALES (Smill.) Begins Apr.Per Jul.Per Oct.Per Jan.Per Full Year to-school period. The top line jumped 24% year to year in the fiscal third quarter (ended October 30th) and edged past our $1.225 billion forecast, as the demand for casual apparel remained high. This was helped by a more-normal back-to-school season. Aerie continued to shine, deliver- ing year-to-year sales growth of 28%, despite revenues surging 34% in the like period of fiscal 2020. There was also un- even inventory flow to contend with, due to factory closures in Vietnam, which im- 2018 823.0 9648 1003.7 1244.2 4035.7 2019 886.3 1040.9 1066.4 1314.6 4308.2 2020 551.7 551.7 883.5 1031.6 1292.3 3759.1 2021 1034.6 11942 1274.1 1517.1 5020 2022 1115 1290 1395 1600 5400 Fiscal EARNINGS PER SHARE AB Full Year Begins Apr.Per Jul.Per Oct.Per Jan.Per al 2018 23 2019 24 2020 d.84 .34 48 .43 148 39 48 37 d.03 35 39 d.13 48 .60 .76 .36 2.20 48 .66 .77 .59 2.50 2021 pacted the availability of Aerie's highly popular (and high-margined) leggings. But perhaps just as important, American Eagle sales bounced back 21% after an 11% decline a year earlier. Refreshed product, higher quality, more effective marketing. and strong demand for denim all lent a hand. Meantime, fixed-cost leverage, more full-price selling, and inventory optimiza- 55 tion efforts drove margins sharply higher. Demand remained strong through the 68 holidays, but higher freight costs are American Eagle spent $360 million to ac- quire Quiet Logistics, an operator of fulfill- ment centers in major metropolitan areas. This was on top of buying another retail logistics firm, AirTerra, earlier in 2021. The moves should reduce delivery costs and increase delivery speed to both cus- tomers and stores, as well as facilitating faster returns and more optimized inven- tory levels, all of which are key in the cur- rent retail landscape. 2022 Full Year Cal- QUARTERLY DIVIDENDS PAIDE endar Mar.31 Jun 30 Sep.30 Dec.31 2018 .138 138 138 .138 2019 .138 138 138 2020 138 138 2021 138 .18 .18 18 2022 ... 41 28 .. We continue to like these shares for the intermediate and long terms. Matthew E Spencer, CFA January 21, 2022 B+ apt to pinch profits in the January term. Leadership expects sales to rise by a (A) Fiscal year ends Sat. closest to Jan. 31st (21c); 15, 2c: '16, (90): 17. (3e): '18. (1e); '19. 1/30/21 $70.3 mill 42e/shr. (E) Div'd paid April, Company's Financial Strength (B) Diluted egs. Excl, nonrecum/discontinued (36e); 20, ($1.13); 21, (6) May not add due July, Oct., and Dec. Suspended 4/20 resumed Stock's Price Stability gainless: 05, 3e; '08, (130); '09, 5e; '10, to rounding. Next egs, report due early March 12/20. Excl. special div'ds: 50c, 12/10; $1.50. Price Growth Persistence (32e); 11, (9): 12. (23c): 13, (31e): 14, (C) In mil, adj. for splits. (D) incl. intangibles at 10/12. (F) Excl. infl licensed stores. Eamings Predictability 2022 Value Line, Inc. All rights reserved. Factual material is obtained from sources believed to be reliable and is provided without warranties of any kind. THE PUBLISHER IS NOT RESPONSIBLE FOR ANY ERRORS OR OMISSIONS HEREN. This publication is strictly for subscriber's own non-commercial internal use. No part 35 35 30 To subscribe call 1-800-VALUELINE of it may be reproduced, resold stored or transmitted in any printed, electronic or other form, or used for generating or marketing any printed or electronic publication, service or product meting PE RATIO DIV'D 23.51 no 10.4(ediaa: 166) RELATE 0.54 3.1% VALUE (15) 150 YLD LINE 15.7 18.5 19.5 19.5 29.9 24.3 20.7 39.0 10.1 13.5 12.8 10.2 16.1 13.7 Target Price Range 6.5 19.7 2024 2025 2026 -64 - 48 40 - Joh -32 tely -24 -20 -16 -12 -8 -6 Huth pengin CA that T THETI # 7. Part 1. Forecasting Quarterly Sales 1. What were your company's sales for the most recent 5 quarters (use Assignmet4Data to complete the table below)? Quarter End Date Value Qt-5 1/31/2021 1292.294 Qt-4 4/30/2021 1034.614 Qt-3 7/31/2021 1194.156 Qt-2 10/31/2021 1274.078 1507.937 Qt-1 (most recent quarter) 1/31/2022 Estimate the Foster Model regression for predicting quarterly sales. 2. For your company, what is the coefficient estimate for the intercept? 33.74081 3. For your company, what is the coefficient estimate for the slope? 0.507757 4. Complete the table below. Using your company's sales regression coefficients and your company's past sales, forecast your company's sales for the next four quarters. Also, collect the Value Line sales forecasts for these quarters from the Value Line Lpage PDF report. Quarter End Date Foster Model Forecast 1177.849 Value Line Forecast 1115 Qt 4/30/2022 Qt+1 7/31/2022 1351.008 1290 Qt+2 10/31/2022 1465.55 1395 Qt+3 1/31/2023 1786.88 1600 RECENT PRICE 23.9 22.6 12.5 13.1 AMERICAN EAGLE NYSE-AEO TIMELINESS 3 Lowered 8/13/21 High: 19.6 16.4 Low: 11.4 10.0 LEGENDS -BOX "Cash Flow ... Helative Price Strength Options Ves SAFETY 3 Raised 8/20/99 TECHNICAL 2 Raised 1/7/22 BETA 1.15 11.00 = Market) 18-Month Target Price Range Low-High Midpoint (% to Mid) Shaded area indicates recession $22-$69 $46 (95%) bibally Ann'l Total 2024-26 PROJECTIONS Price Gain Return High 50 (+115%) 22% Low (+50%) 12% 35 (+50%) Institutional Decisions % TOT. RETURN 12/21 T THIS VL ARITH. 30211 Percent STOCK INDEX 102021 20201 302021 127 75 50 29.7 Buy 25.4 162 shares 177 vaded 1 yr. 3 yr. 175 175 161 T 41.2 to 84.2 Sel 25 Hld s00176439 185235 178467 5 yr. 91.6 88.5 2022 VALUE LINE PUB. LLC 24-26 2005 2006 2007 2008 2009 10.41 12.63 14.94 14.56 14.46 15.27 1.68 2.15 2.49 1.64 1.47 1.78 32.35 Sales per sh 42.60 4.10 "Cash Flow per sh 5.25 2010 2011 2012 2013 2014 2015 2016 2017 2018 2019 2020 2021 16.30 18.05 17.12 16.88 19.55 19.85 21.41 23.40 25.80 22.60 29.75 1.59 2.10 1.36 1.36 2.01 2.12 2.12 2.50 2.58 85 3.65 .86 1.39 74 63 1.09 1.25 1.16 1.48 1.48 d.13 2.20 44 55 38 50 50 50 50 55 55 14 .68 6.04 5.86 5.84 6.62 7.03 7.47 7.47 6.53 8.60 1.26 1.70 1.82 .99 .76 1.02 2.50 Earnings per sh An 3.15 19 28 38 40 40 72 Div'ds Decl'd per sh E .72 43 6.86 7.63 6.95 7.31 5.21 6.41 6.56 6.34 9.90 Book Value per sh 14.20 155.00 13.0 .70 1.7% 6600 40.0% Bold figures are Avg Ann'l P/E Ratio Value Line Relative P/E Ratio estimates Avg Ann'l Div'd Yield 5400 Sales (Smill) 42.5% Gross Margin 15.8% Operating Margin 1140 Number of Stores F 510 Net Profit (Smil) 23.0% Income Tax Rate 9.4% Net Profit Margin 15.3% Total Debt $336,2 mill. Due in 5 Yrs $336 2 mill LT Debt $336.2 mill LT Interest $12 mil. (Total interest coverage: NMF) (19% of Cap') Leases, Uncapitalized Annual rentals $363.2 mill 1250 213.3 615 41.8% 33.7% 41.6% 33.7% 23.0% No Defined Benefit Pension Plan 36.0% 37.3% 39.4% 5.3% 8.0% 4.3% 882.1 705.9 508.1 229.5 35.6% 35.6% 6.4 % 407.4 9.3% 3.7% 6.1 % 431.4 259.7 500 Working Cap'l (Smill) 300 Pid Stock None .. .. .. MI .. Common Stock 168,621,661 shs. as of 11/19/21 2200 MARKET CAP: $4.0 billion (Mid Cap) 28.0% 28.0% 21.5% 23% CURRENT POSITION 2019 2020 10/30/21 (SMILL.) 221.90 221.28 204.48 205.28 206.83 194.37 193.85 192.60 193.15 194.52 180.14 181.89 177.32 172.44 166.99 166.34 168.60 167.00 Common Shs Outst'g 14.2 14.8 142 14.7 19.1 14.8 16.0 14.0 23.4 20.1 14.9 13.1 12.1 14.8 12.0 12.0 76 .80 75 88 1.27 94 1.00 .89 1.31 1.06 75 69 61 80 64 65 1.0% 1.1% 1.5% 2.7% 2.8% 2.8% 3.2% 2.8% 2.2% 3.9% 31% 3.1% 3.6% 2.5% 3.1% 1.0% CAPITAL STRUCTURE as of 10/30/21 3159.8 3475.83305.8 3282.9 3521.8 3609.9 3795.5 4035.7 4308.2 3759.1 5020 35.7% 40.0% 34.6% 35.2% 37.0% 37.9 % 36.2% 35.9% 35.3% 30.5% 42.5% 126 % 16.2% 10.7% 10.6 % 13.3% 14.1% 13.0 % 12.6% 11.4% 4.5% 15.5% 1090 1044 1066 1056 1047 1050 1047 1055 1095 1078 1120 168.5 278.7 143.0 123.0 208.3 263.1 252.5 d21.6 455 37.3% 39.4% 34.4% 24.1% 22,5% NMF 23.0% 5.5 % 6.5% 5.9 % NMF 9.1% 483.3 503.6 296.1 664.1 600 325.3 .. 335 335 Long-Term Debt (Smill) 1416.9 1221.2 1166.2 1139.7 1051.4 1204.6 1246.8 12876 1247.9 1086.7 1450 1650 Shr. Equity (Smill) 11.9% 22.8% 12.3% 10.8% 20.3% 19.1% 16.7% 20.4% 20.2% NMF 26.5% 26.5% Return on Total Cap'l 11.9% 22.8 % 12.3% 10.8% 20.3% 19.1% 16.7 % 20.4% 20.2% NMF 31.5% 31.0% Return on Shr. Equity 5.9% 13.9% 6.1% 2.3% 11.0% 11.5% 96% 12.9% 12.8% NMF 21.5% 22.0% Retained to Com Eq 51% 30% 51% 43% 37% 37% NMF 79% 46% 40% 31% 29% All Div'ds to Net Prof BUSINESS: American Eagle Outfitters is a specialty retailer of subscribed, and three Todd Snyders. Sold 77kids in 12; Bluenotes men's and women's casual apparel and accessories-targeting the in '04. Closed MARTIN-OSA in 10. Has about 37,000 employees. 15-to-25 year old customer segment. The company had 897 Amer- Officers and directors own 8.2% of common stock; FMR LLC, ican Eagle retail stores in the U.S. and Canada (as of 10/30/21), 14.9% (4/21 Proxy). Chairman & CEO: Jay L. Schottenstein. In- which are located primarily in shopping malls, as well as 256 fran- corporated: Delaware, Address: 77 Hot Metal St., Pittsburgh, Penn- chised shops. Also operates 216 stand-alone aerie stores, four Un- sylvania 15203. Telephone: 412-432-3300 Internet: www.ae.com. American Eagle Outfitters put togeth- mid- to high-teens rate, but in order to Past Est'd 18-20 er an impressive showing in the back- meet demand and avoid supply-chain snags, it had to rely on air freight, which is expected to add $80 million in addi- tional costs (incremental freight costs were about $5 million in the October interim). Management is investing in its supply chain. Given the slew of supply-chain woes in recent months, just getting mer- chandise in stock has become half the battle. At the same time, the shift toward online shopping accelerated during the pandemic, and consumers have grown ac- customed to fast deliveries. As a result, Cash Assets Receivables 416.9 119.1 850.5 740.7 146.1 228.5 446.3 Inventory (Avg Cost) Other Current Assets Accts Payable Debt Due Other 405 4 739.8 65.6 120.6 66.5 1047.9 1522.6 1775.5 285.7 255.9 314.6 1661 CON C 466.1 602.6 555.0 751.8 858.5 869.6 Past 10 Yrs. Current Liab. ANNUAL RATES of change (per sh) Sales "Cash Flow" Earnings Dividends Book Value 5.0% 2.0% Nil Nil 5 Yrs. 24-26 6.0% 10.0% 4.5% 17,5% 3.0% 22.5% -2.0% 9.5% Nil 4.0% 12.0% Fiscal QUARTERLY SALES (Smill.) Begins Apr.Per Jul.Per Oct.Per Jan.Per Full Year to-school period. The top line jumped 24% year to year in the fiscal third quarter (ended October 30th) and edged past our $1.225 billion forecast, as the demand for casual apparel remained high. This was helped by a more-normal back-to-school season. Aerie continued to shine, deliver- ing year-to-year sales growth of 28%, despite revenues surging 34% in the like period of fiscal 2020. There was also un- even inventory flow to contend with, due to factory closures in Vietnam, which im- 2018 823.0 9648 1003.7 1244.2 4035.7 2019 886.3 1040.9 1066.4 1314.6 4308.2 2020 551.7 551.7 883.5 1031.6 1292.3 3759.1 2021 1034.6 11942 1274.1 1517.1 5020 2022 1115 1290 1395 1600 5400 Fiscal EARNINGS PER SHARE AB Full Year Begins Apr.Per Jul.Per Oct.Per Jan.Per al 2018 23 2019 24 2020 d.84 .34 48 .43 148 39 48 37 d.03 35 39 d.13 48 .60 .76 .36 2.20 48 .66 .77 .59 2.50 2021 pacted the availability of Aerie's highly popular (and high-margined) leggings. But perhaps just as important, American Eagle sales bounced back 21% after an 11% decline a year earlier. Refreshed product, higher quality, more effective marketing. and strong demand for denim all lent a hand. Meantime, fixed-cost leverage, more full-price selling, and inventory optimiza- 55 tion efforts drove margins sharply higher. Demand remained strong through the 68 holidays, but higher freight costs are American Eagle spent $360 million to ac- quire Quiet Logistics, an operator of fulfill- ment centers in major metropolitan areas. This was on top of buying another retail logistics firm, AirTerra, earlier in 2021. The moves should reduce delivery costs and increase delivery speed to both cus- tomers and stores, as well as facilitating faster returns and more optimized inven- tory levels, all of which are key in the cur- rent retail landscape. 2022 Full Year Cal- QUARTERLY DIVIDENDS PAIDE endar Mar.31 Jun 30 Sep.30 Dec.31 2018 .138 138 138 .138 2019 .138 138 138 2020 138 138 2021 138 .18 .18 18 2022 ... 41 28 .. We continue to like these shares for the intermediate and long terms. Matthew E Spencer, CFA January 21, 2022 B+ apt to pinch profits in the January term. Leadership expects sales to rise by a (A) Fiscal year ends Sat. closest to Jan. 31st (21c); 15, 2c: '16, (90): 17. (3e): '18. (1e); '19. 1/30/21 $70.3 mill 42e/shr. (E) Div'd paid April, Company's Financial Strength (B) Diluted egs. Excl, nonrecum/discontinued (36e); 20, ($1.13); 21, (6) May not add due July, Oct., and Dec. Suspended 4/20 resumed Stock's Price Stability gainless: 05, 3e; '08, (130); '09, 5e; '10, to rounding. Next egs, report due early March 12/20. Excl. special div'ds: 50c, 12/10; $1.50. Price Growth Persistence (32e); 11, (9): 12. (23c): 13, (31e): 14, (C) In mil, adj. for splits. (D) incl. intangibles at 10/12. (F) Excl. infl licensed stores. Eamings Predictability 2022 Value Line, Inc. All rights reserved. Factual material is obtained from sources believed to be reliable and is provided without warranties of any kind. THE PUBLISHER IS NOT RESPONSIBLE FOR ANY ERRORS OR OMISSIONS HEREN. This publication is strictly for subscriber's own non-commercial internal use. No part 35 35 30 To subscribe call 1-800-VALUELINE of it may be reproduced, resold stored or transmitted in any printed, electronic or other form, or used for generating or marketing any printed or electronic publication, service or product meting PE RATIO DIV'D 23.51 no 10.4(ediaa: 166) RELATE 0.54 3.1% VALUE (15) 150 YLD LINE 15.7 18.5 19.5 19.5 29.9 24.3 20.7 39.0 10.1 13.5 12.8 10.2 16.1 13.7 Target Price Range 6.5 19.7 2024 2025 2026 -64 - 48 40 - Joh -32 tely -24 -20 -16 -12 -8 -6 Huth pengin CA that T THETI # 7