

Answered step by step
Verified Expert Solution
Question
1 Approved Answer
Question 4 the next slide is for question 4 but those answers belong to another question that I got but they are going to ask
Question 4 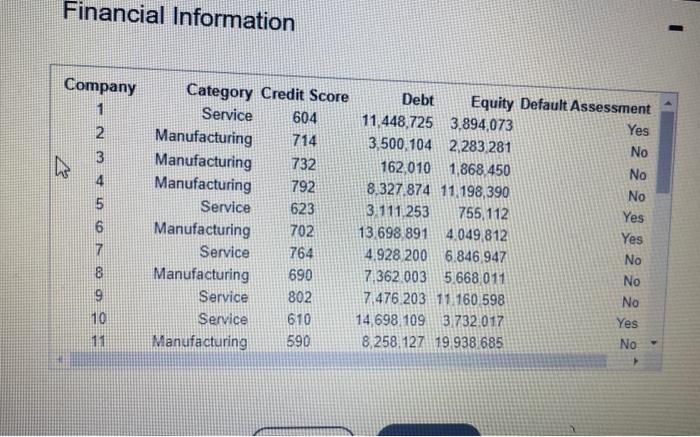
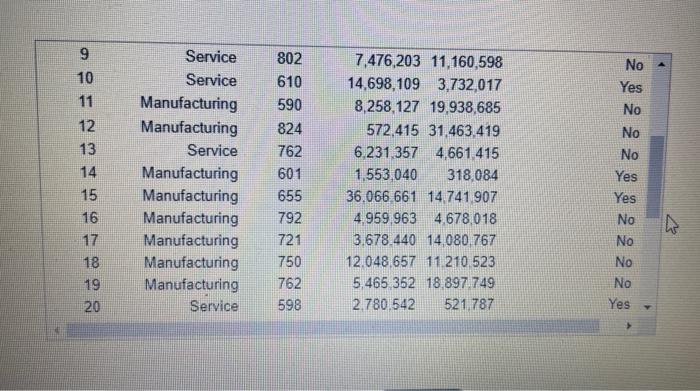
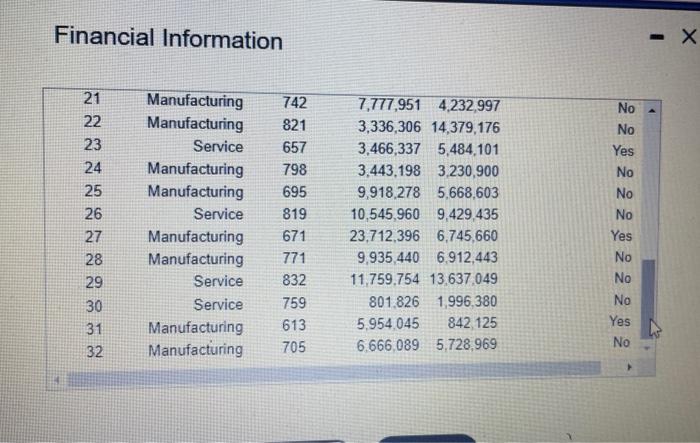
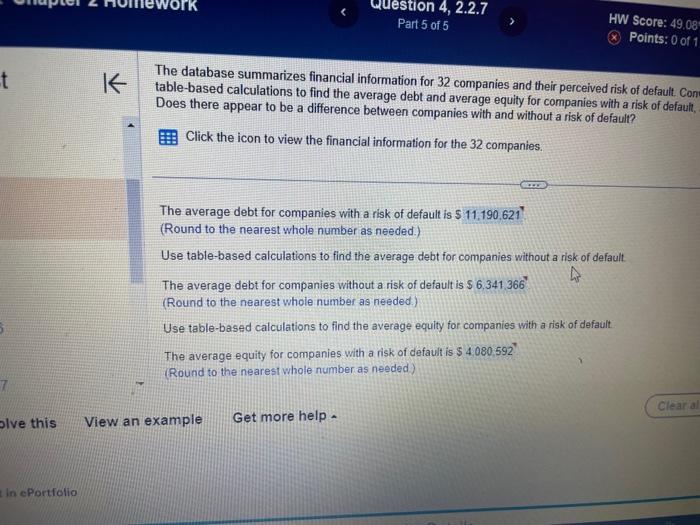
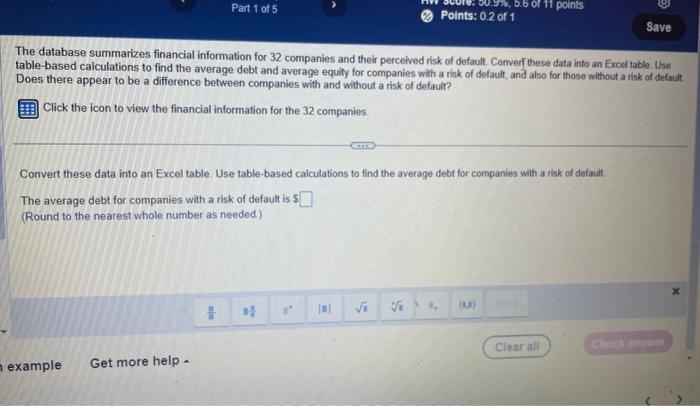
Financial Information \begin{tabular}{|crrrrr|} \hline 9 & Service & 802 & 7,476,203 & 11,160,598 & No \\ 10 & Service & 610 & 14,698,109 & 3,732,017 & Yes \\ 11 & Manufacturing & 590 & 8,258,127 & 19,938,685 & No \\ 12 & Manufacturing & 824 & 572,415 & 31,463,419 & No \\ 13 & Service & 762 & 6,231,357 & 4,661,415 & No \\ 14 & Manufacturing & 601 & 1,553,040 & 318,084 & Yes \\ 15 & Manufacturing & 655 & 36,066,661 & 14,741,907 & Yes \\ 16 & Manufacturing & 792 & 4,959,963 & 4,678.018 & No \\ 17 & Manufacturing & 721 & 3,678.440 & 14,080,767 & No \\ 18 & Manufacturing & 750 & 12,048.657 & 11,210.523 & No \\ 19 & Manufacturing & 762 & 5.465,352 & 18.897.749 & No \\ 20 & & 598 & 2.780.542 & 521.787 & Yes - \end{tabular} Financial Information The database summarizes financial information for 32 companies and their perceived risk of default. Con table-based calculations to find the average debt and average equity for companies with a risk of default, Does there appear to be a difference between companies with and without a risk of default? Click the icon to view the financial information for the 32 companies. The average debt for companies with a risk of default is 5 (Round to the nearest whole number as needed.) Use table-based calculations to find the average debt for companies without a risk of default. The average debt for companies without a risk of default is $6,341,366 (Round to the nearest whole number as needed.) Use table-based calculations to find the average equity for companies with a risk of default The average equity for companies with a risk of default is $4.080.592 ? (Round to the nearest whole number as needed) The database summarizes financial information for 32 companies and their perceived risk of default. Converf these data into an Excel table Use table-based calculations to find the average debt and average equity for companies with a risk of default, and also for those without a ritk of defaut Does there appear to be a difference between companies with and without a risk of defaulr? Click the icon to view the financial information for the 32 companies Convert these data into an Excel table. Use table-based calculations to find the average debt for companies with a risk of default The average debt for companies with a risk of default is 5 (Round to the nearest whole number as needed) Financial Information \begin{tabular}{|crrrrr|} \hline 9 & Service & 802 & 7,476,203 & 11,160,598 & No \\ 10 & Service & 610 & 14,698,109 & 3,732,017 & Yes \\ 11 & Manufacturing & 590 & 8,258,127 & 19,938,685 & No \\ 12 & Manufacturing & 824 & 572,415 & 31,463,419 & No \\ 13 & Service & 762 & 6,231,357 & 4,661,415 & No \\ 14 & Manufacturing & 601 & 1,553,040 & 318,084 & Yes \\ 15 & Manufacturing & 655 & 36,066,661 & 14,741,907 & Yes \\ 16 & Manufacturing & 792 & 4,959,963 & 4,678.018 & No \\ 17 & Manufacturing & 721 & 3,678.440 & 14,080,767 & No \\ 18 & Manufacturing & 750 & 12,048.657 & 11,210.523 & No \\ 19 & Manufacturing & 762 & 5.465,352 & 18.897.749 & No \\ 20 & & 598 & 2.780.542 & 521.787 & Yes - \end{tabular} Financial Information The database summarizes financial information for 32 companies and their perceived risk of default. Con table-based calculations to find the average debt and average equity for companies with a risk of default, Does there appear to be a difference between companies with and without a risk of default? Click the icon to view the financial information for the 32 companies. The average debt for companies with a risk of default is 5 (Round to the nearest whole number as needed.) Use table-based calculations to find the average debt for companies without a risk of default. The average debt for companies without a risk of default is $6,341,366 (Round to the nearest whole number as needed.) Use table-based calculations to find the average equity for companies with a risk of default The average equity for companies with a risk of default is $4.080.592 ? (Round to the nearest whole number as needed) The database summarizes financial information for 32 companies and their perceived risk of default. Converf these data into an Excel table Use table-based calculations to find the average debt and average equity for companies with a risk of default, and also for those without a ritk of defaut Does there appear to be a difference between companies with and without a risk of defaulr? Click the icon to view the financial information for the 32 companies Convert these data into an Excel table. Use table-based calculations to find the average debt for companies with a risk of default The average debt for companies with a risk of default is 5 (Round to the nearest whole number as needed) the next slide is for question 4 but those answers belong to another question that I got but they are going to ask them for this problem if you could pleass solve them but change the financial information I provided
Step by Step Solution
There are 3 Steps involved in it
Step: 1

Get Instant Access to Expert-Tailored Solutions
See step-by-step solutions with expert insights and AI powered tools for academic success
Step: 2

Step: 3
Ace Your Homework with AI
Get the answers you need in no time with our AI-driven, step-by-step assistance
Get Started
Benchmarking Islamic Finance
Authors: Mohd Ma'Sum Billah
1st Edition
0367546469, 978-0367546465