Question 5 1 pts Physical therapists measure a patient's manual dexterity with a simple task. The patient picks up small cylinders from a 4 *
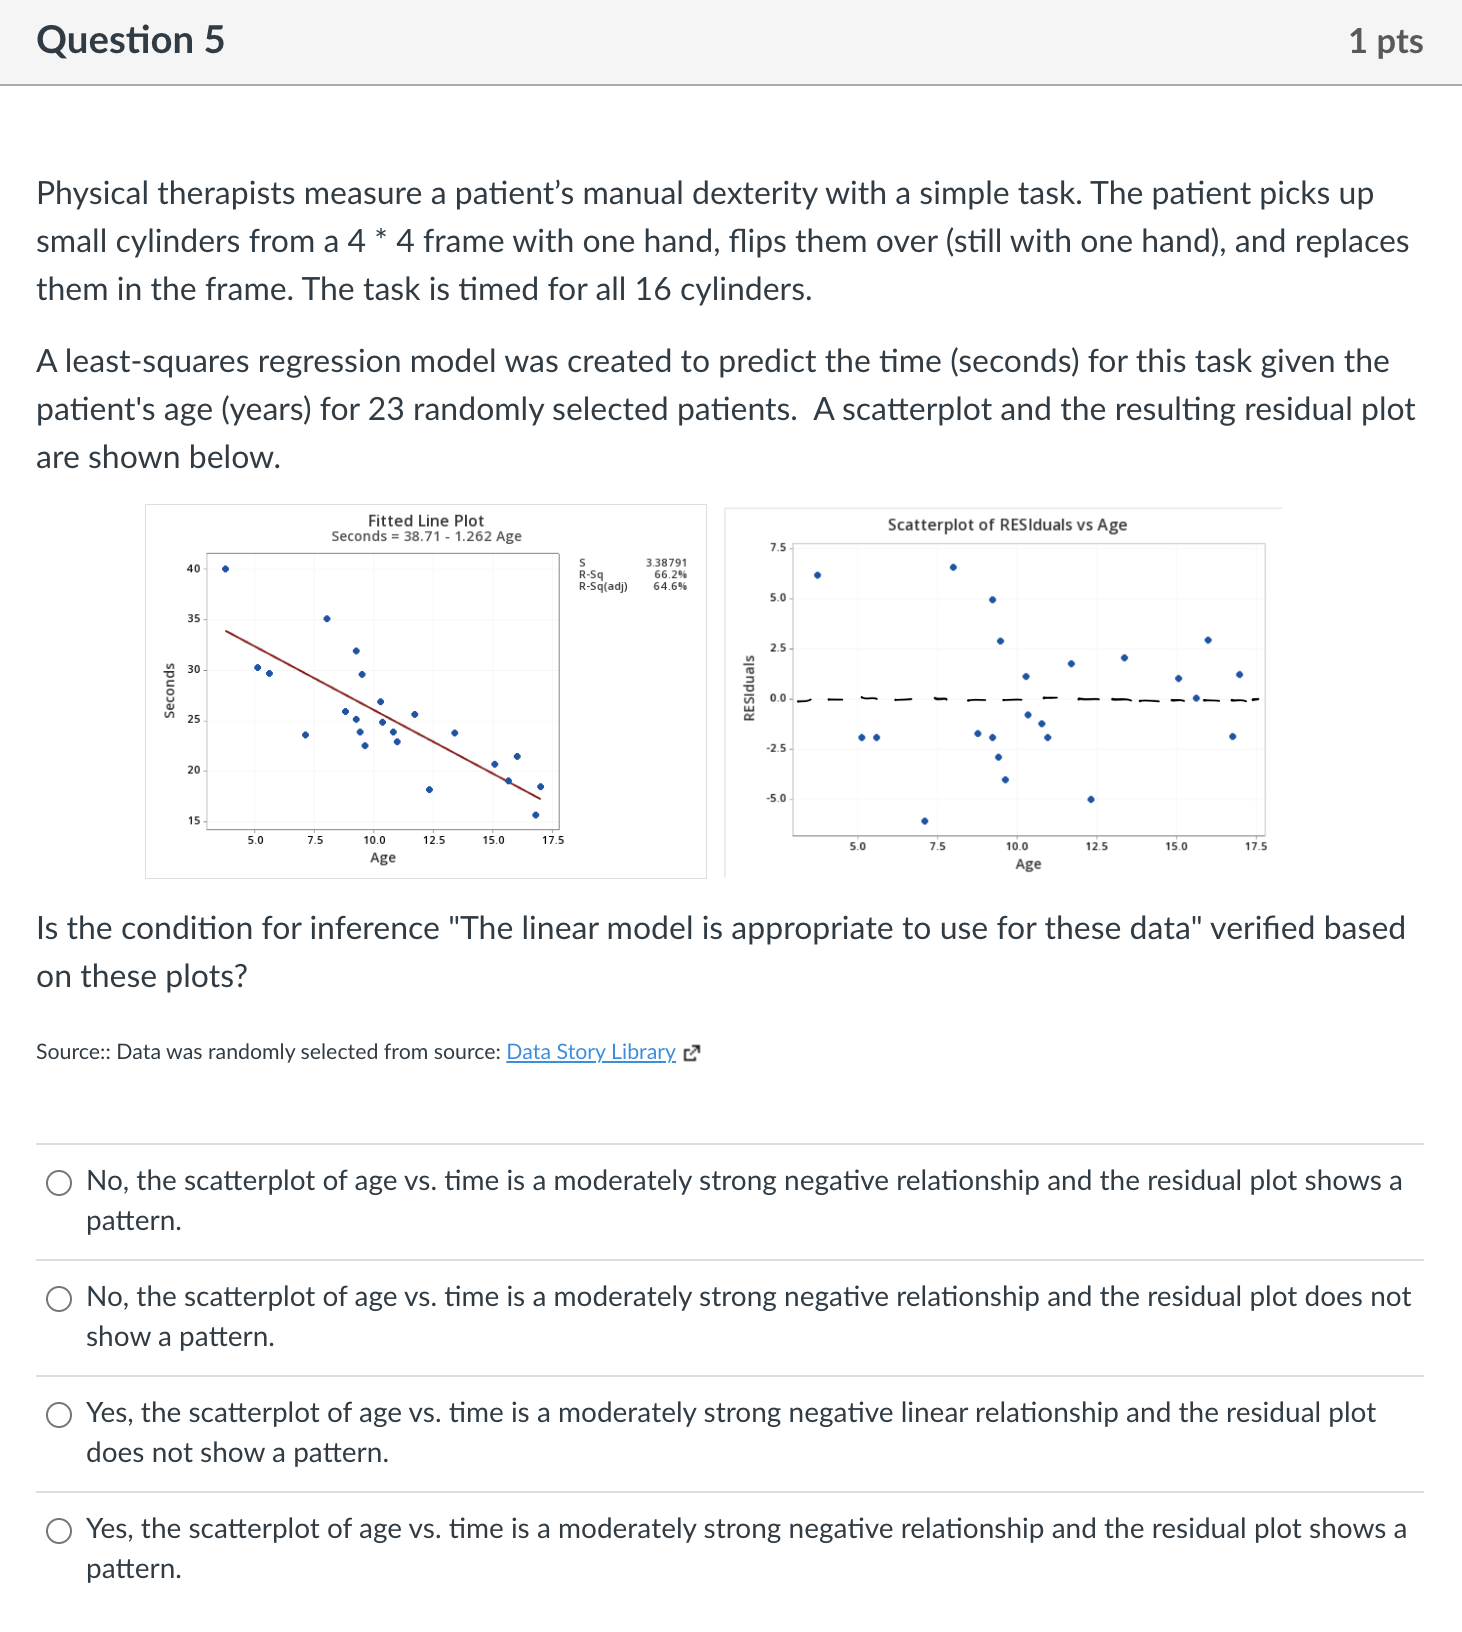
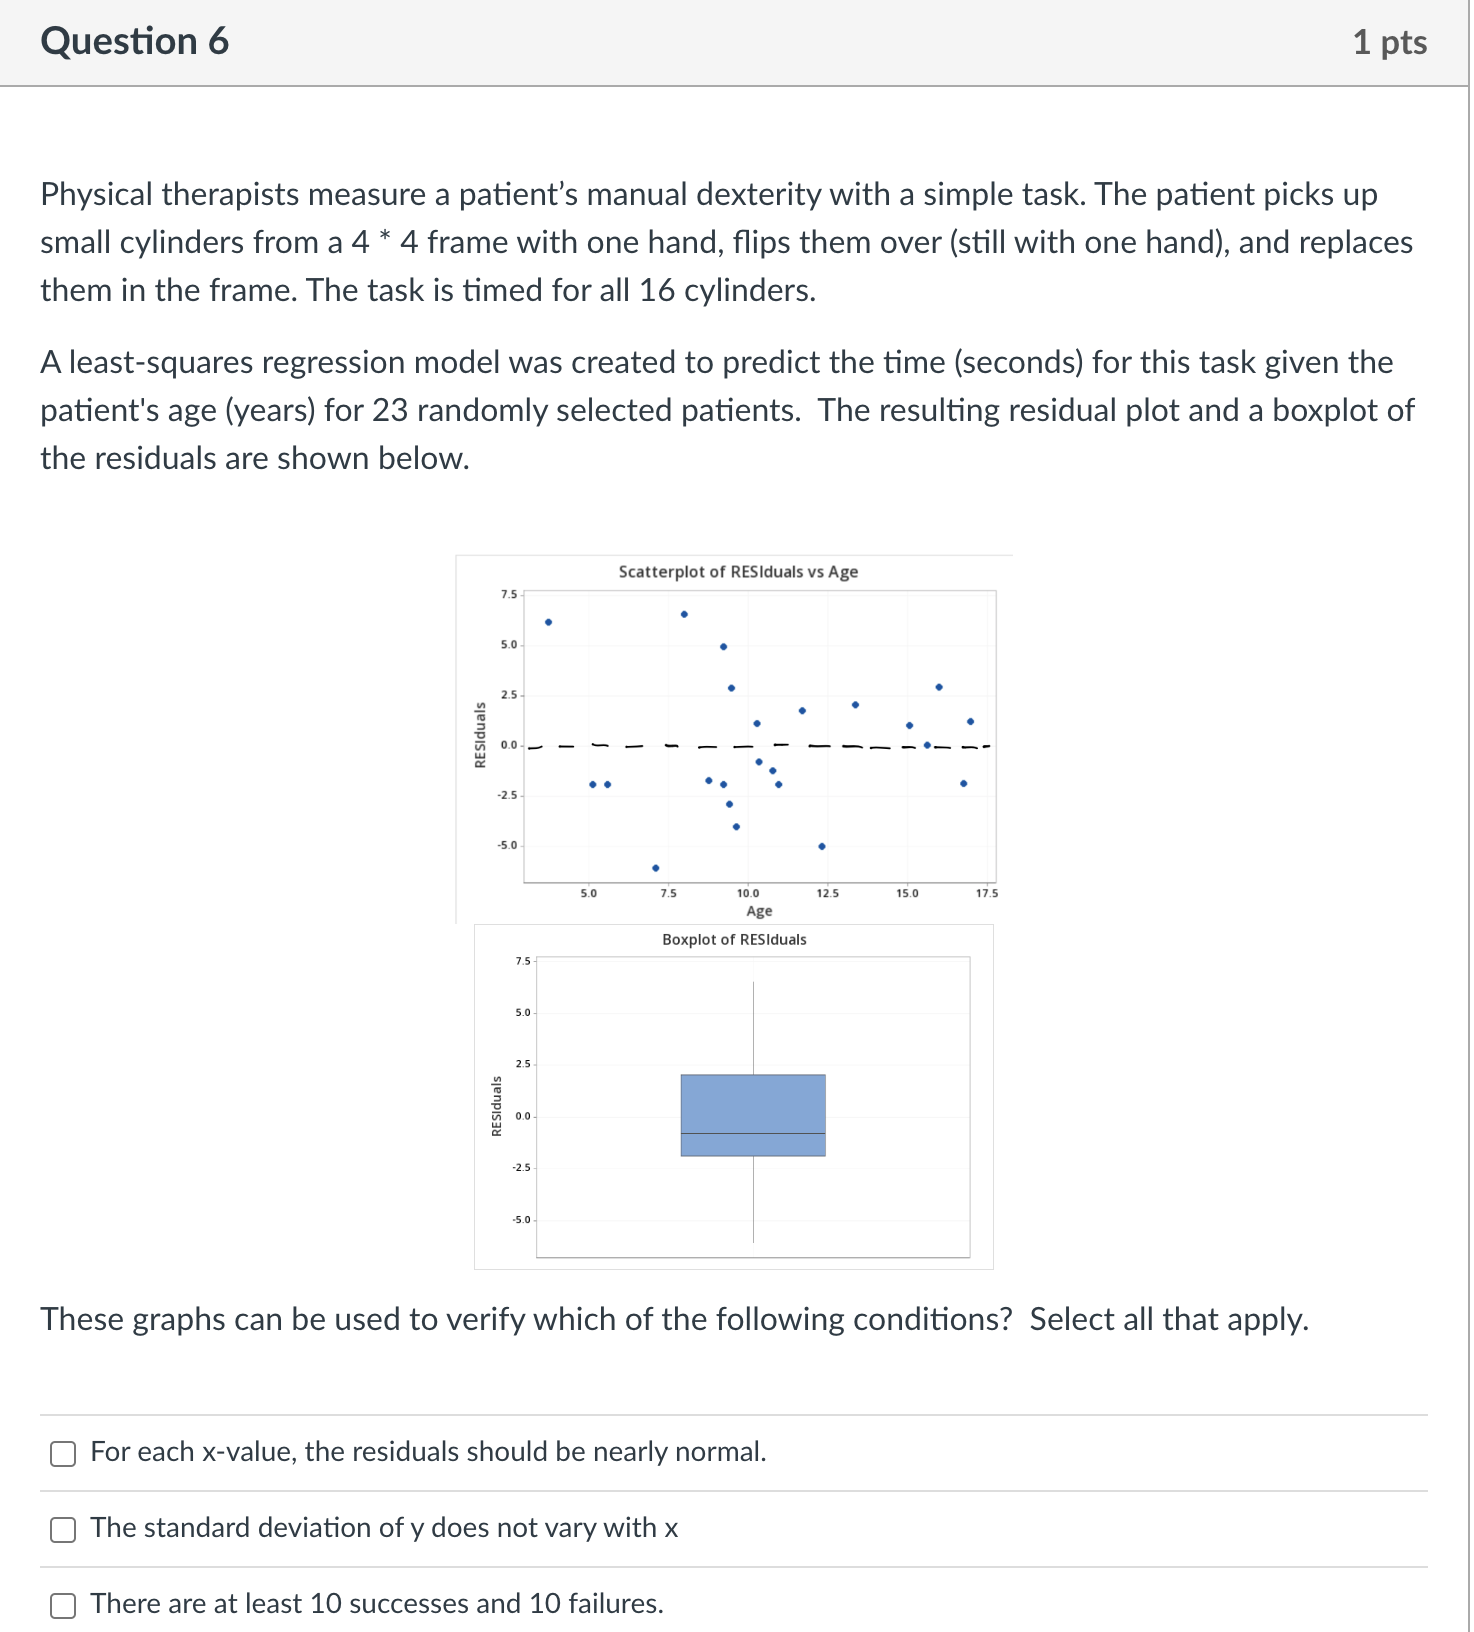
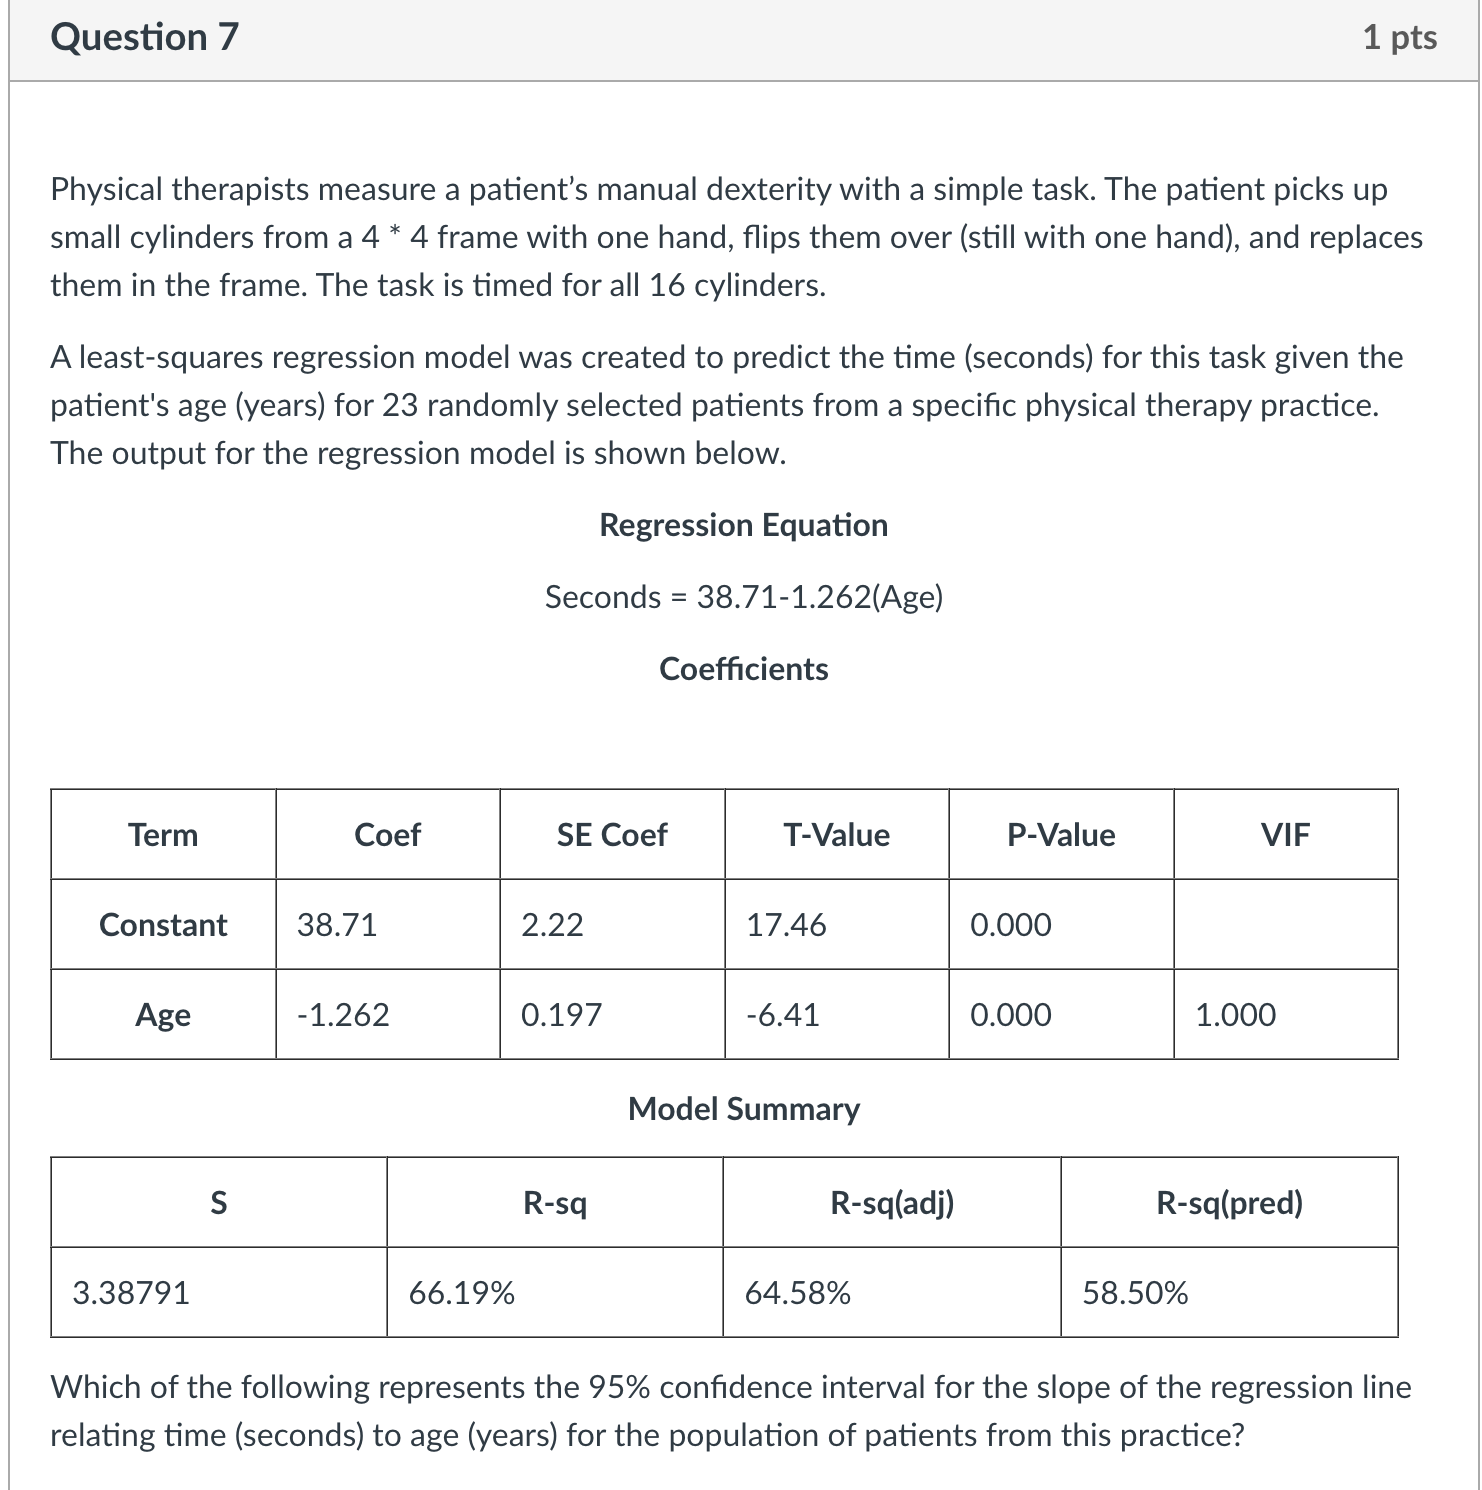
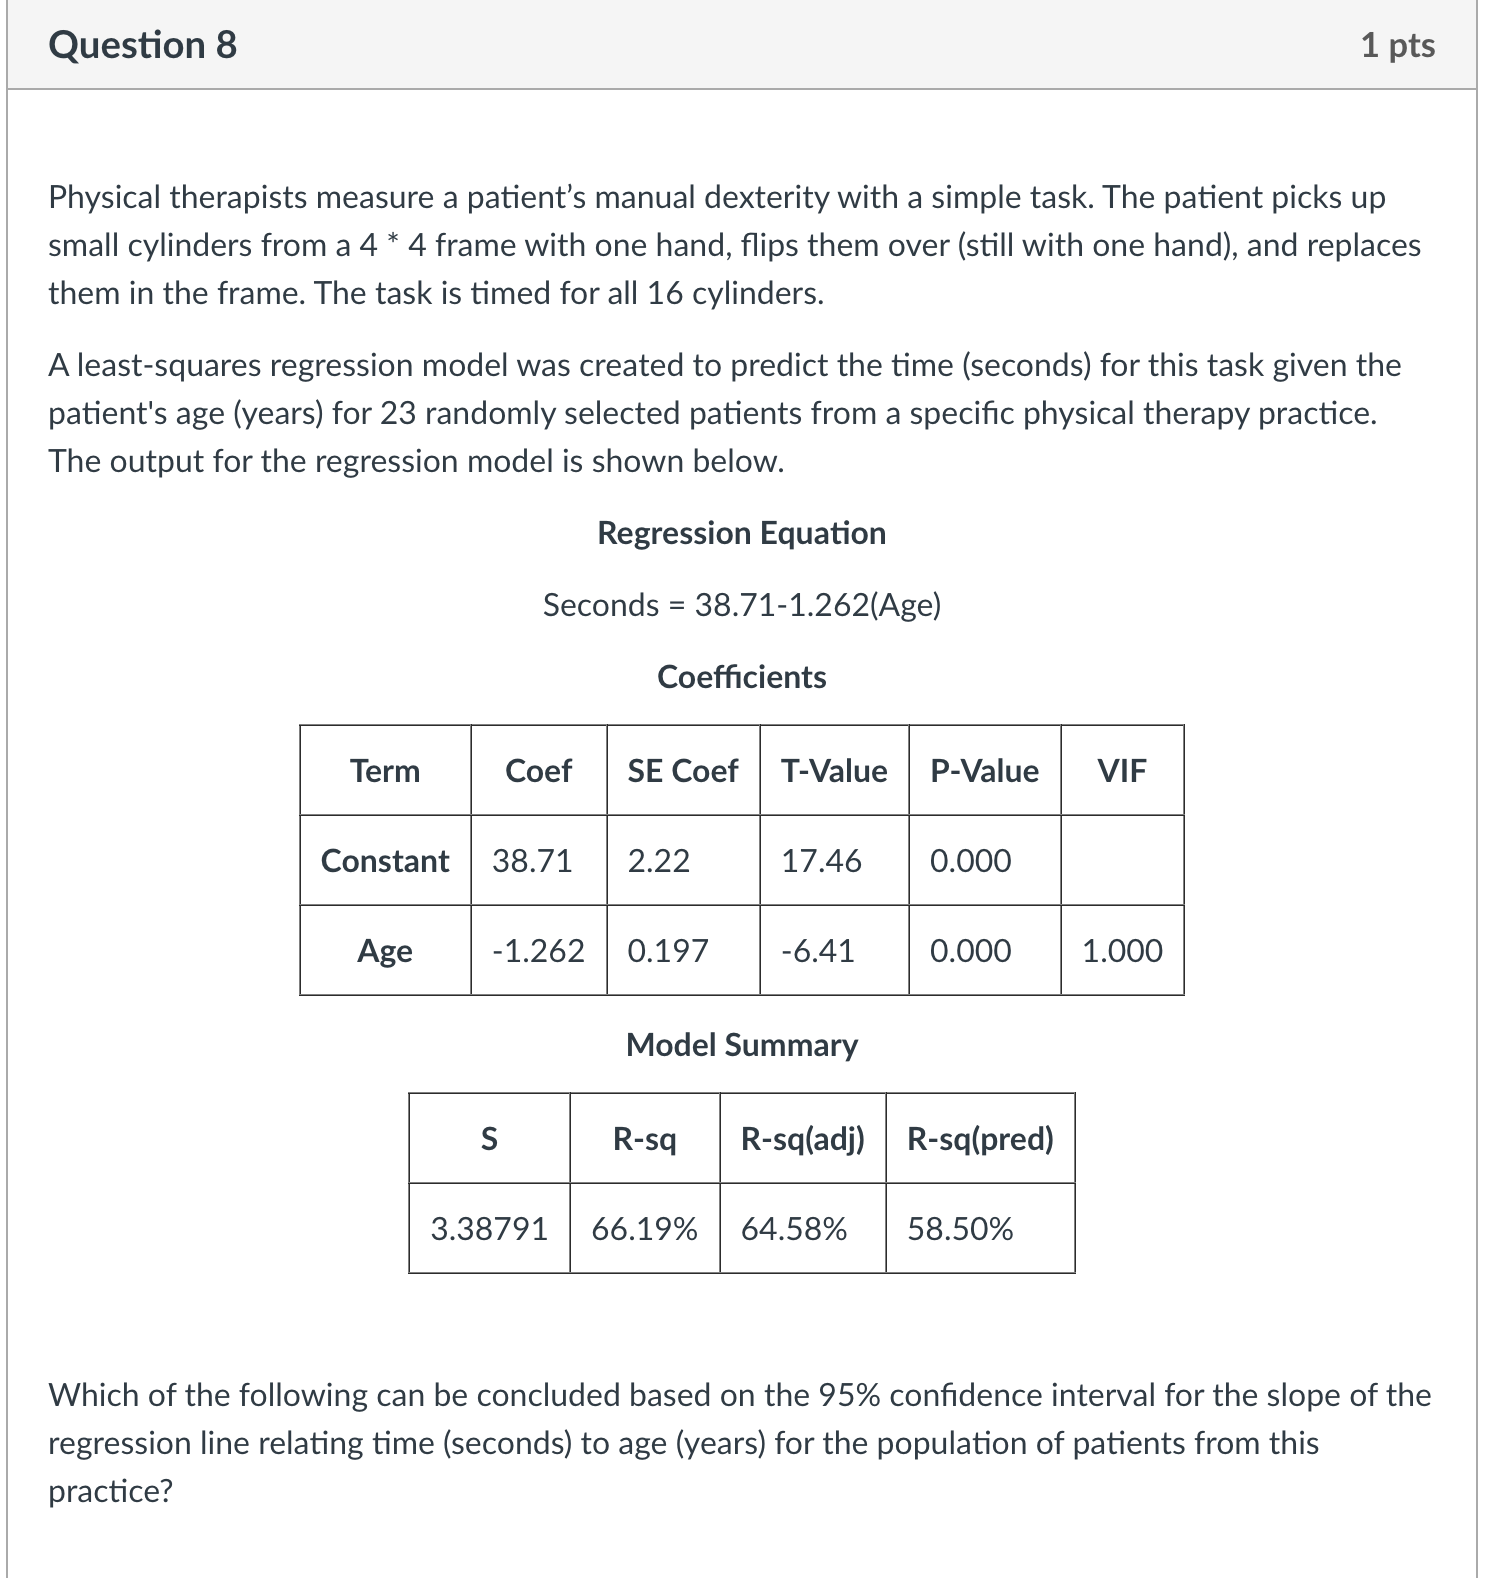
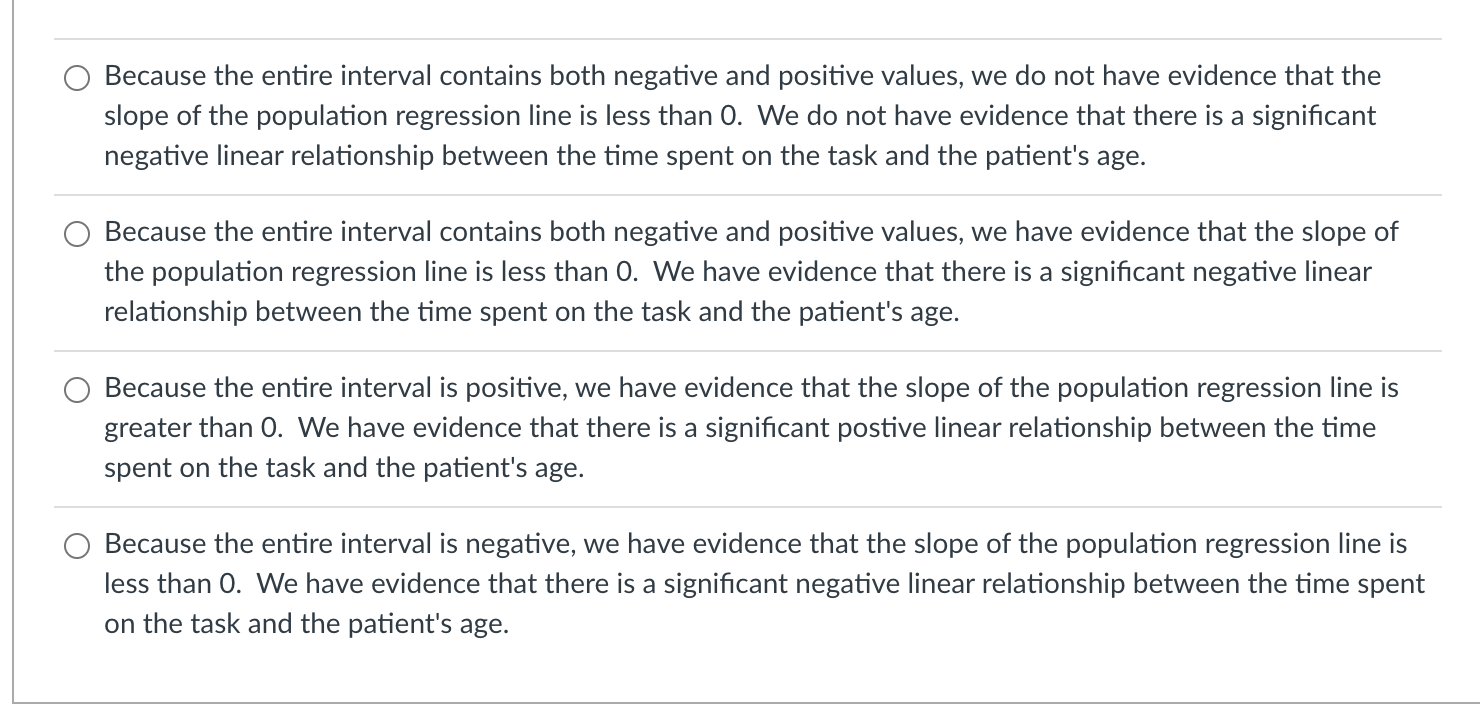
Question 5 1 pts Physical therapists measure a patient's manual dexterity with a simple task. The patient picks up small cylinders from a 4 * 4 frame with one hand, ips them over (still with one hand), and replaces them in the frame. The task is timed for all 16 cylinders. A least-squares regression model was created to predict the time (seconds) for this task given the patient's age (years) for 23 randomly selected patients. A scatterplot and the resulting residual plot are shown below. Fitted Line Plot Seconds = 38.71 _ 1262 Age 15. Scatterplot of RESlduals vs Age 5 3.3!791 . R-Sq an 29: - RVSqtadj} 54 596 40 I 5.07 I 35 2.5- 307 00'...___ -__-___O__- Seconds RESlduals 25. .15. 20 5.0 0 l5 . 0 5|] 7.5 100 12.5 15\" '15 Age 5.0 7 5 I03 12.5 150 \".5 Age Is the condition for inference "The linear model is appropriate to use for these data" veried based on these plots? Source: Data was randomly selected from source: Data Story Library E] O No, the scatterplot of age vs. time is a moderately strong negative relationship and the residual plot shows a pattern. 0 No, the scatterplot of age vs. time is a moderately strong negative relationship and the residual plot does not show a pattern. 0 Yes, the scatterplot of age vs. time is a moderately strong negative linear relationship and the residual plot does not show a pattern. 0 Yes, the scatterplot of age vs. time is a moderately strong negative relationship and the residual plot shows a pattern. Question 6 1 pts Physical therapists measure a patient's manual dexterity with a simple task. The patient picks up small cylinders from a 4 * 4 frame with one hand, flips them over (still with one hand), and replaces them in the frame. The task is timed for all 16 cylinders. A least-squares regression model was created to predict the time (seconds) for this task given the patient's age (years) for 23 randomly selected patients. The resulting residual plot and a boxplot of the residuals are shown below. Scatterplot of RESIduals vs Age 7.5 50 2.5 RESIdual 0.0 - - 2. 50 5.0 10.0 125 15.0 17.5 Age Boxplot of RESIduals 15 5.0 2.5 RESIdual 0.0 .2.5 5.0 These graphs can be used to verify which of the following conditions? Select all that apply. For each x-value, the residuals should be nearly normal. The standard deviation of y does not vary with x There are at least 10 successes and 10 failures.Question 7 1 pts Physical therapists measure a patient's manual dexterity with a simple task. The patient picks up small cylinders from a 4 * 4 frame with one hand, ips them over (still with one hand), and replaces them in the frame. The task is timed for all 16 cylinders. A least-squares regression model was created to predict the time (seconds) for this task given the patient's age (years) for 23 randomly selected patients from a specic physical therapy practice. The output for the regression model is shown below. Regression Equation Seconds = 38.71-1.262(Age) Coefcients Model Summary 3.38791 66.19% 64.58% 58.50% Which of the following represents the 95% condence interval for the slope of the regression line relating time (seconds) to age (years) for the population of patients from this practice? \fQuestion 8 1 pts Physical therapists measure a patient's manual dexterity with a simple task. The patient picks up small cylinders from a 4 * 4 frame with one hand, ips them over (still with one hand), and replaces them in the frame. The task is timed for all 16 cylinders. A least-squares regression model was created to predict the time (seconds) for this task given the patient's age (years) for 23 randomly selected patients from a specic physical therapy practice. The output for the regression model is shown below. Regression Equation Seconds = 38.71-1.262(Age) Coefcients 38.71 2.22 17.46 0.000 - -1.262 0.197 0.000 1.000 Model Summary 3.38791 66.19% 64.58% 58.50% Which of the following can be concluded based on the 95% condence interval for the slope of the regression line relating time (seconds) to age (years) for the population of patients from this practice? 0 Because the entire interval contains both negative and positive values, we do not have evidence that the slope of the population regression line is less than 0. We do not have evidence that there is a signicant negative linear relationship between the time spent on the task and the patient's age. 0 Because the entire interval contains both negative and positive values, we have evidence that the slope of the population regression line is less than 0. We have evidence that there is a signicant negative linear relationship between the time spent on the task and the patient's age. 0 Because the entire interval is positive, we have evidence that the slope of the population regression line is greater than 0. We have evidence that there is a signicant postive linear relationship between the time spent on the task and the patient's age. 0 Because the entire interval is negative, we have evidence that the slope of the population regression line is less than 0. We have evidence that there is a signicant negative linear relationship between the time spent on the task and the patient's age
Step by Step Solution
There are 3 Steps involved in it
Step: 1
Get Instant Access to Expert-Tailored Solutions
See step-by-step solutions with expert insights and AI powered tools for academic success
Step: 2
Step: 3
Ace Your Homework with AI
Get the answers you need in no time with our AI-driven, step-by-step assistance