Answered step by step
Verified Expert Solution
Link Copied!

Question

1 Approved Answer

Question 5. ( 15 points) Consider an economy described by the following data: = $3.25 trillion = $1.3 trillion G = $3.5 trillion T =
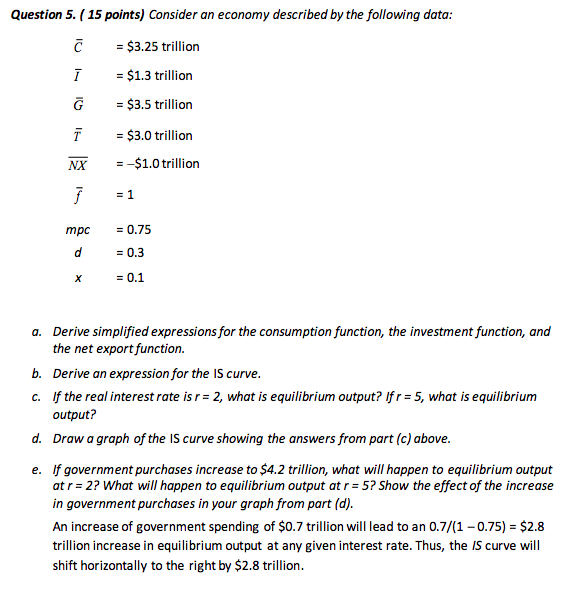
image text in transcribed
Question 5. ( 15 points) Consider an economy described by the following data: = $3.25 trillion = $1.3 trillion G = $3.5 trillion T = $3.0 trillion NX = -$1.0 trillion = 1 mpc = 0.75 d = 0.3 X = 0.1 a. Derive simplified expressions for the consumption function, the investment function, and the net export function. b. Derive an expression for the IS curve. c. If the real interest rate is r = 2, what is equilibrium output? If r = 5, what is equilibrium output? d. Draw a graph of the IS curve showing the answers from part (c) above. e. If government purchases increase to $4.2 trillion, what will happen to equilibrium output at r = 2? What will happen to equilibrium output at r = 5? Show the effect of the increase in government purchases in your graph from part (d). An increase of government spending of $0.7 trillion will lead to an 0.7/(1 - 0.75) = $2.8 trillion increase in equilibrium output at any given interest rate. Thus, the IS curve will shift horizontally to the right by $2.8 trillion

Step by Step Solution

There are 3 Steps involved in it

Step: 1

blur-text-image

Get Instant Access to Expert-Tailored Solutions

See step-by-step solutions with expert insights and AI powered tools for academic success

Step: 2

blur-text-image_2

Step: 3

blur-text-image_3

Ace Your Homework with AI

Get the answers you need in no time with our AI-driven, step-by-step assistance

Get Started

Recommended Textbook for

Macroeconomics Principles and Applications

Authors: Robert e. hall, marc Lieberman

5th edition

1111397465, 9781439038970, 1439038988, 978-1111397463, 143903897X, 9781439038987, 978-1133265238

More Books

Students also viewed these Economics questions

Question

true or false? {x}{x} True False

Answered: 1 week ago