

Answered step by step
Verified Expert Solution
Question
1 Approved Answer
Question 5 Following are the financial statements of Target Corporation from 13 tiste Target Corporation Consolidated Statements of Financial Position For Fiscal Years Ended (5
Question 5 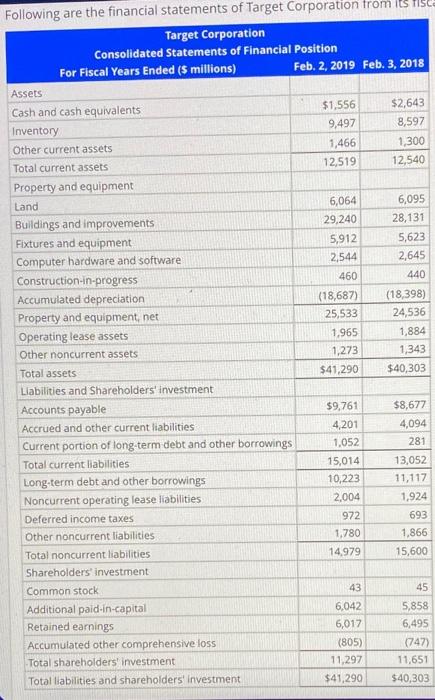
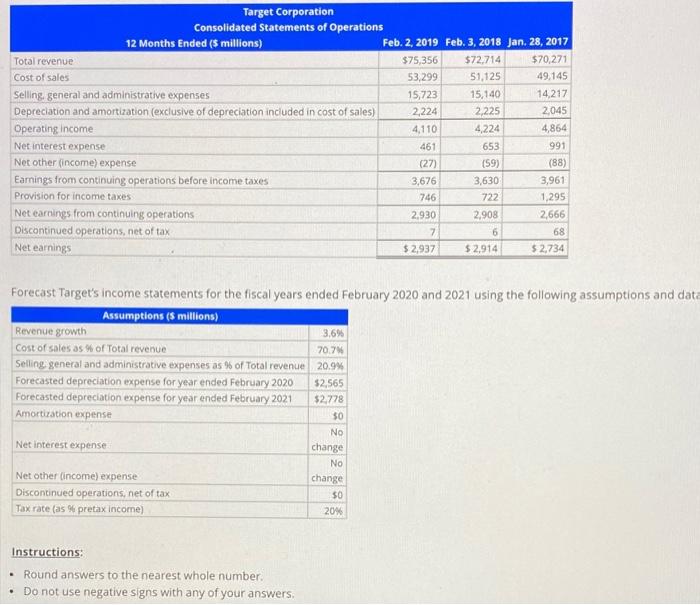
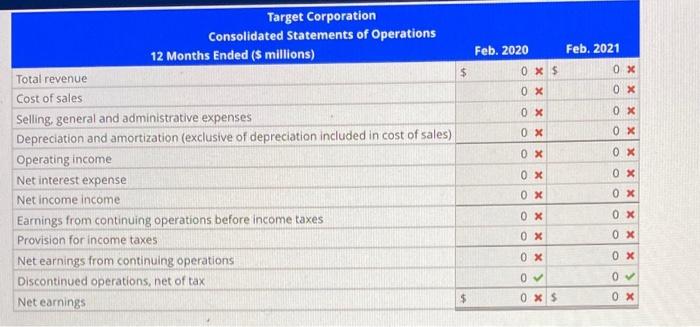
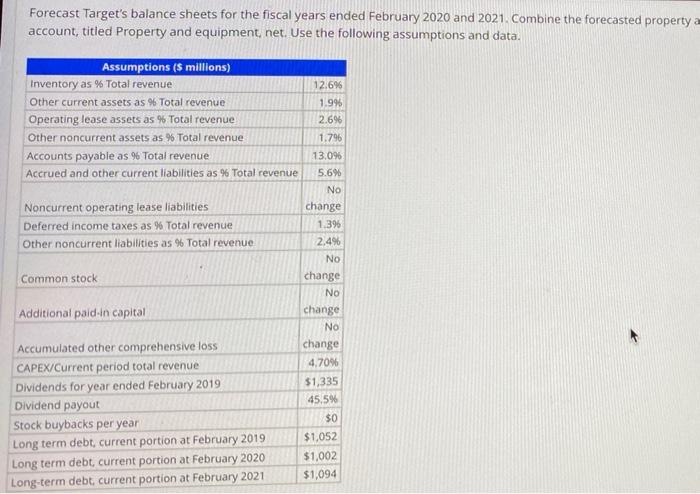
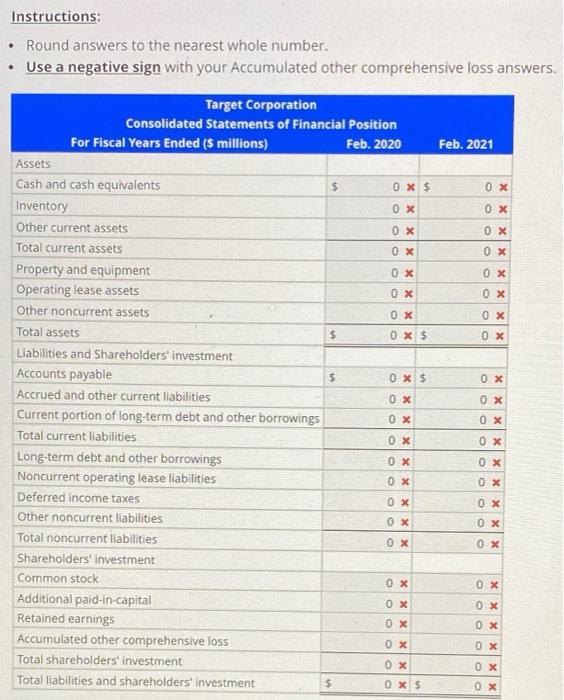
Following are the financial statements of Target Corporation from 13 tiste Target Corporation Consolidated Statements of Financial Position For Fiscal Years Ended (5 millions) Feb. 2, 2019 Feb. 3, 2018 Assets Cash and cash equivalents $1,556 $2,643 Inventory 9,497 8,597 Other current assets 1,466 1,300 Total current assets 12,519 12,540 Property and equipment Land 6,064 6,095 Buildings and improvements 29,240 28,131 Fixtures and equipment, 5,912 5,623 Computer hardware and software 2,544 2,645 Construction in progress 460 440 Accumulated depreciation (18,687 (18,398) Property and equipment net 25,533 24,536 Operating lease assets 1,965 1,884 Other noncurrent assets 1,273 1,343 Total assets $41,290 $40,303 Llabilities and Shareholders' investment Accounts payable $9,761 $8,677 Accrued and other current liabilities 4,201 4,094 Current portion of long-term debt and other borrowings 1.052 281 Total current liabilities 15,014 13,052 Long-term debt and other borrowings 10,223 11,117 Noncurrent operating lease liabilities 2,004 1,924 Deferred income taxes 972 693 Other noncurrent liabilities 1,780 1,866 Total noncurrent liabilities 14,979 15,600 Shareholders investment Common stock 43 45 Additional paid-in-capital 6,042 5,858 Retained earnings 6,017 6,495 Accumulated other comprehensive loss (805) (747) Total shareholders investment 11,297 11,651 Total liabilities and shareholders investment $41,290 $40,303 Target Corporation Consolidated Statements of Operations 12 Months Ended (5 millions) Feb. 2. 2019 Feb. 3, 2018 Jan. 28, 2017 Total revenue $75,356 $72,714 $70,271 Cost of sales 53,299 51,125 49,145 Selling, general and administrative expenses 15,723 15,140 14,217 Depreciation and amortization (exclusive of depreciation included in cost of sales) 2,224 2,225 2045 Operating income 4,110 4,224 4,864 Net interest expense 461 653 991 Net other (income) expense (27) (59) (88) Earnings from continuing operations before income taxes 3,676 3,630 3,961 Provision for income taxes 746 722 1,295 Net earnings from continuing operations 2.930 2,908 2,666 Discontinued operations, net of tax 7 6 68 Net earnings $ 2,937 $ 2,914 $ 2,734 Forecast Target's income statements for the fiscal years ended February 2020 and 2021 using the following assumptions and data Assumptions (5 millions) Revenue growth 3,6% Cost of sales as % of Total revenue 70.79 Selling general and administrative expenses as % of Total revenue 20.9% Forecasted depreciation expense for year ended February 2020 $2,565 Forecasted depreciation expense for year ended February 2021 $2.778 Amortization expense $0 No Net interest expense change No Net other income) expense change Discontinued operations, net of tax $0 Tax rate (as % pretax income) 20% Instructions: Round answers to the nearest whole number. Do not use negative signs with any of your answers. Feb. 2020 Feb, 2021 $ 0 X 0 X $ OX 0 X OX 0 X 0 X 0 x Target Corporation Consolidated Statements of Operations 12 Months Ended ($ millions) Total revenue Cost of sales Selling, general and administrative expenses Depreciation and amortization (exclusive of depreciation included in cost of sales) Operating income Net interest expense Net income income Earnings from continuing operations before income taxes Provision for income taxes Net earnings from continuing operations Discontinued operations, net of tax Net earnings OX OX 0X 0 x 0X OX 0X OX 0X 0 x OX 0 0 0 X 5 0X Forecast Target's balance sheets for the fiscal years ended February 2020 and 2021. Combine the forecasted property a account, titled Property and equipment net. Use the following assumptions and data. Assumptions ($ millions) Inventory as % Total revenue 12.6% Other current assets as % Total revenue 1.996 Operating lease assets as % Total revenue 2.696 Other noncurrent assets as % Total revenue 1.796 Accounts payable as % Total revenue 13.096 Accrued and other current liabilities as % Total revenue 5.6% No Noncurrent operating lease liabilities change Deferred income taxes as % Total revenue 1.396 Other noncurrent liabilities as % Total revenue 2,4% No Common stock change NO Additional paid in capital change No Accumulated other comprehensive loss change CAPEX/Current period total revenue 4.70% Dividends for year ended February 2019 $1,335 Dividend payout 45.5% $0 Stock buybacks per year $1,052 Long term debt current portion at February 2019 Long term debt current portion at February 2020 $1,002 $1,094 Long-term debt current portion at February 2021 Instructions: Round answers to the nearest whole number. Use a negative sign with your Accumulated other comprehensive loss answers. Feb. 2021 0 x 0 x 0 x 0 x 0 x 0 x 0 x 0 x 0 x Target Corporation Consolidated Statements of Financial Position For Fiscal Years Ended ($ millions) Feb. 2020 Assets Cash and cash equivalents $ Ox $ Inventory 0 x Other current assets OX Total current assets 0 x Property and equipment OX Operating lease assets 0 x Other noncurrent assets OX Total assets $ Ox $ Liabilities and Shareholders' investment Accounts payable $ Ox $ Accrued and other current liabilities OX Current portion of long-term debt and other borrowings Ox Total current liabilities OX Long-term debt and other borrowings OX Noncurrent operating lease liabilities OX Deferred income taxes OX Other noncurrent liabilities 0 x Total noncurrent liabilities 0 x Shareholders' investment Common stock Ox Additional paid-in-capital 0 x Retained earnings 0 x Accumulated other comprehensive loss Ox Total shareholders' investment OX Total liabilities and shareholders' investment $ 0 X OX 0 x OX 0 x 0 x 0 x OX OX 0 x OX OX OX 0 x Step by Step Solution
There are 3 Steps involved in it
Step: 1

Get Instant Access to Expert-Tailored Solutions
See step-by-step solutions with expert insights and AI powered tools for academic success
Step: 2

Step: 3
Ace Your Homework with AI
Get the answers you need in no time with our AI-driven, step-by-step assistance
Get Started
Understanding Financial Statements A Manager S Guide
Authors: David S. Murphy Ph.D. ,Ernest W. Murphy
1st Edition
1530688787, 978-1530688784