Answered step by step
Verified Expert Solution
Link Copied!

Question

1 Approved Answer

Question 5: (Matlab) The goal of this question is to generate some random variables (RVs) and construct their PDFs and CDFs using Matlab and then
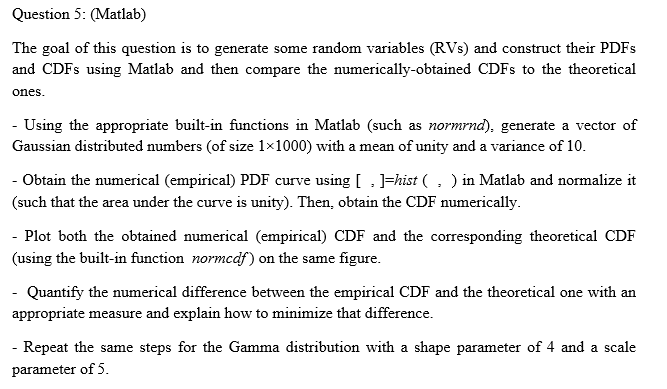
image text in transcribed

Question 5: (Matlab) The goal of this question is to generate some random variables (RVs) and construct their PDFs and CDFs using Matlab and then compare the numerically-obtained CDFs to the theoretical ones Using the appropriate built-in functions in Matlab (such as normrnd), generate a vector of Gaussian distributed numbers (of size 1x1000) with a mean of unity and a variance of 10. Obtain the numerical (empirical) PDF curve using Hhist ( ) in Matlab and normalize it (such that the area under the curve is unity). Then, obtain the CDF numerically Plot both the obtained numerical (empirical) CDF and the corresponding theoretical CDIF (using the built-in function normcdf) on the same figure. Quantify the numerical difference between the empirical CDF and the theoretical one with an appropriate measure and explain how to minimize that difference. Repeat the same steps for the Gamma distribution with a shape parameter of 4 and a scale parameter of 5. Question 5: (Matlab) The goal of this question is to generate some random variables (RVs) and construct their PDFs and CDFs using Matlab and then compare the numerically-obtained CDFs to the theoretical ones Using the appropriate built-in functions in Matlab (such as normrnd), generate a vector of Gaussian distributed numbers (of size 1x1000) with a mean of unity and a variance of 10. Obtain the numerical (empirical) PDF curve using Hhist ( ) in Matlab and normalize it (such that the area under the curve is unity). Then, obtain the CDF numerically Plot both the obtained numerical (empirical) CDF and the corresponding theoretical CDIF (using the built-in function normcdf) on the same figure. Quantify the numerical difference between the empirical CDF and the theoretical one with an appropriate measure and explain how to minimize that difference. Repeat the same steps for the Gamma distribution with a shape parameter of 4 and a scale parameter of 5

Step by Step Solution

There are 3 Steps involved in it

Step: 1

blur-text-image

Get Instant Access to Expert-Tailored Solutions

See step-by-step solutions with expert insights and AI powered tools for academic success

Step: 2

blur-text-image

Step: 3

blur-text-image

Ace Your Homework with AI

Get the answers you need in no time with our AI-driven, step-by-step assistance

Get Started

Recommended Textbook for

More Books

Students also viewed these Databases questions

Question

How is intelligence defined?

Answered: 1 week ago

Question

8. Explain the relationship between communication and context.

Answered: 1 week ago