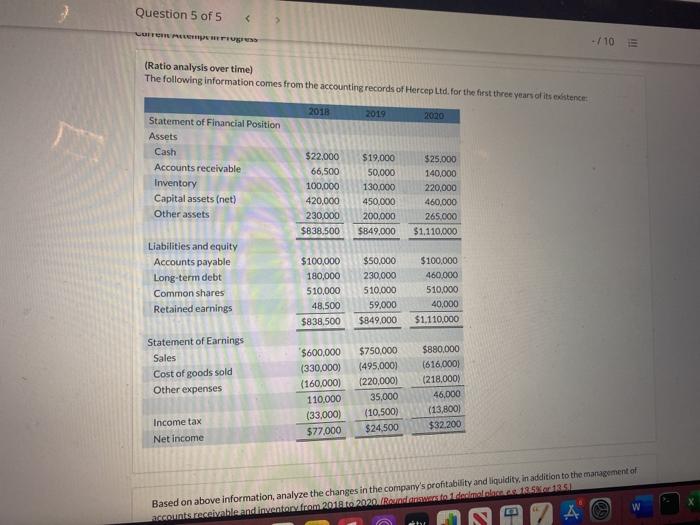
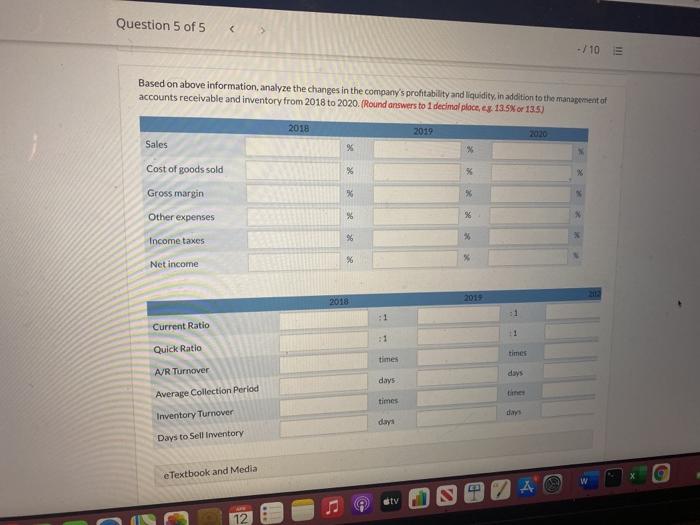
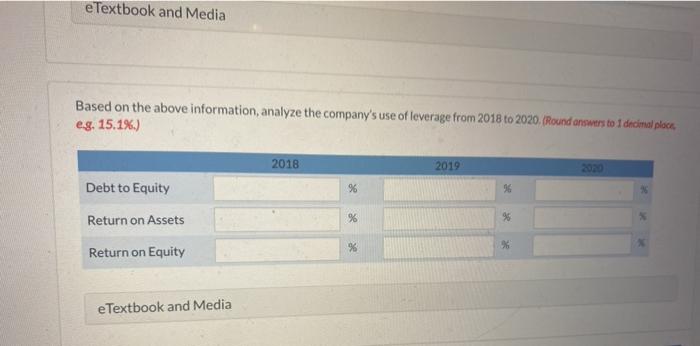
Question 5 of 5 LUFTEN THE -/10 E (Ratio analysis over time) The following information comes from the accounting records of Hercep Ltd. for the first three years of its existence 2018 2019 2020 Statement of Financial Position Assets Cash Accounts receivable Inventory Capital assets (net) Other assets $22.000 66,500 100,000 420,000 230,000 $838.500 $19,000 50.000 130.000 450.000 200.000 $849,000 $25.000 140,000 220,000 460.000 265.000 $1.110,000 Liabilities and equity Accounts payable Long-term debt Common shares Retained earnings $100,000 180,000 510,000 48.500 $838,500 $50,000 230,000 510,000 59,000 $849,000 $100,000 460,000 510,000 40,000 $1.110,000 Statement of Earnings Sales Cost of goods sold Other expenses $600,000 (330,000) (160.000) 110,000 (33.000) $77.000 $750,000 (495,000) (220,000) 35,000 (10.500) $24,500 $880,000 (616,000) (218,000) 46,000 (13.800) $32.200 Income tax Net Income Based on above information, analyze the changes in the company's profitability and liquidity, in addition to the management of accounts receivable and inventory from 2018 to 2020 / A W - Question 5 of 5 - / 10 Based on above information, analyze the changes in the company's profitability and liquidity. in addition to the management of accounts receivable and inventory from 2018 to 2020. (Round answers to 1 decimal place, 13.5% or 135) 2018 2019 Sales % % Cost of goods sold % % Gross margin % % Other expenses % % 26 Income taxes Net income 2018 2013 :1 Current Ratio 1 Quick Ratio times times AVR Turnover days days Average Collection Period times days Inventory Turnover day Days to Sell Inventory e Textbook and Media 2 aty 12 e Textbook and Media Based on the above information, analyze the company's use of leverage from 2018 to 2020. (Round answers to 1 decimal place, eg. 15.1%) 2018 2019 % Debt to Equity Return on Assets % 95 % % Return on Equity e Textbook and Media