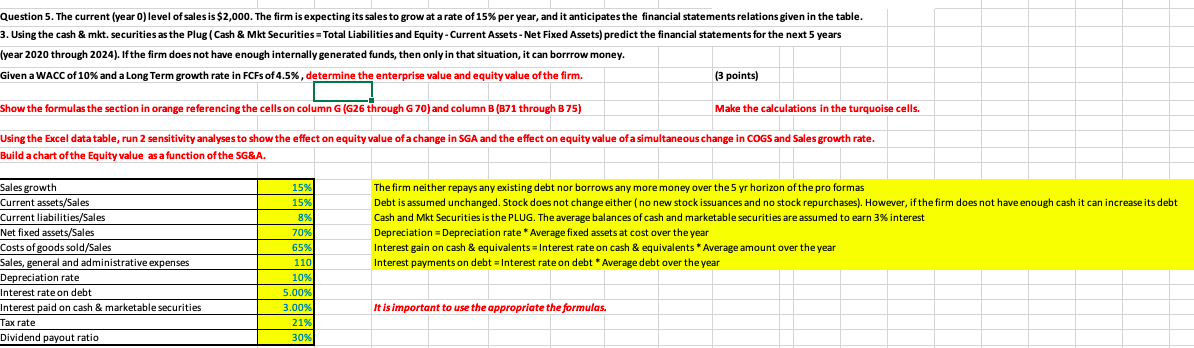
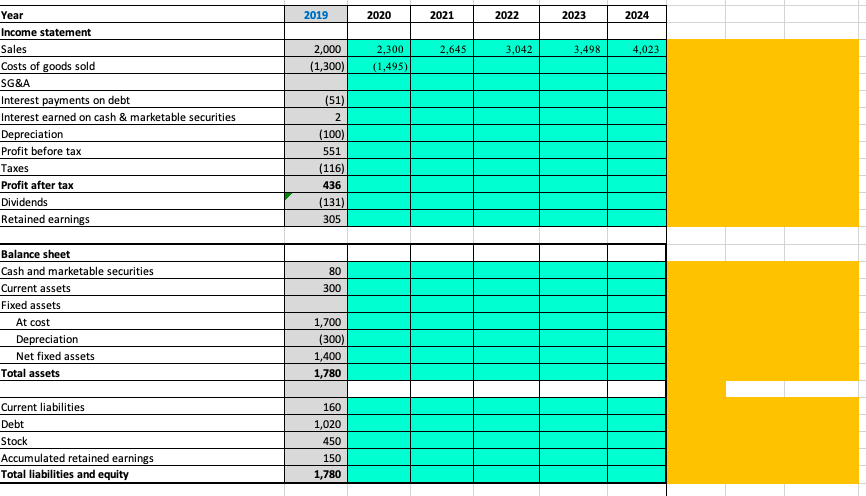
Question 5. The current (year 0) level of sales is $2,000. The firm is expecting its sales to grow at a rate of 15% per year, and it anticipates the financial statements relations given in the table. 3. Using the cash & mkt. securities as the Plug (Cash & Mkt Securities = Total Liabilities and Equity - Current Assets - Net Fixed Assets) predict the financial statements for the next 5 years (year 2020 through 2024). If the firm does not have enough internally generated funds, then only in that situation, it can borrrow money. Given a WACC of 10% and a Long Term growth rate in FCFs of 4.5%, determine the enterprise value and equity value of the firm. (3 points) Show the formulas the section in orange referencing the cells on column G (G26 through G70) and column B (B71 through B 75) Make the calculations in the turquoise cells. Using the Excel data table, run 2 sensitivity analyses to show the effect on equity value of a change in SGA and the effect on equity value of a simultaneous change in COGS and Sales growth rate. Build a chart of the Equity value as a function of the SG&A. Sales growth Current assets/Sales Current liabilities/Sales Net fixed assets/Sales Costs of goods sold/Sales Sales, general and administrative expenses Depreciation rate Interest rate on debt Interest paid on cash & marketable securities Tax rate Dividend payout ratio 15% 15% 8% 70% 65% 110 10% 5.00% 3.00% 21% 30% The firm neither repays any existing debt nor borrows any more money over the 5 yr horizon of the pro formas Debt is assumed unchanged. Stock does not change either (no new stock issuances and no stock repurchases). However, if the firm does not have enough cash it can increase its debt Cash and Mkt Securities is the PLUG. The average balances of cash and marketable securities are assumed to earn 3% interest Depreciation = Depreciation rate * Average fixed assets at cost over the year Interest gain on cash & equivalents = Interest rate on cash & equivalents * Average amount over the year Interest payments on debt = Interest rate on debt * Average debt over the year It is important to use the appropriate the formulas. 2019 2020 2021 2022 2023 2024 2,645 3,042 3,498 4,023 2,000 (1,300) 2,300 (1,495) Year Income statement Sales Costs of goods sold SG&A Interest payments on debt Interest earned on cash & marketable securities Depreciation Profit before tax Taxes Profit after tax Dividends Retained earnings (51) 2 (100) 551 (116) 436 (131) 305 80 300 Balance sheet Cash and marketable securities Current assets Fixed assets At cost Depreciation Net fixed assets Total assets 1,700 (300) 1,400 1,780 160 Current liabilities Debt Stock Accumulated retained earnings Total liabilities and equity 1,020 450 150 1,780 Question 5. The current (year 0) level of sales is $2,000. The firm is expecting its sales to grow at a rate of 15% per year, and it anticipates the financial statements relations given in the table. 3. Using the cash & mkt. securities as the Plug (Cash & Mkt Securities = Total Liabilities and Equity - Current Assets - Net Fixed Assets) predict the financial statements for the next 5 years (year 2020 through 2024). If the firm does not have enough internally generated funds, then only in that situation, it can borrrow money. Given a WACC of 10% and a Long Term growth rate in FCFs of 4.5%, determine the enterprise value and equity value of the firm. (3 points) Show the formulas the section in orange referencing the cells on column G (G26 through G70) and column B (B71 through B 75) Make the calculations in the turquoise cells. Using the Excel data table, run 2 sensitivity analyses to show the effect on equity value of a change in SGA and the effect on equity value of a simultaneous change in COGS and Sales growth rate. Build a chart of the Equity value as a function of the SG&A. Sales growth Current assets/Sales Current liabilities/Sales Net fixed assets/Sales Costs of goods sold/Sales Sales, general and administrative expenses Depreciation rate Interest rate on debt Interest paid on cash & marketable securities Tax rate Dividend payout ratio 15% 15% 8% 70% 65% 110 10% 5.00% 3.00% 21% 30% The firm neither repays any existing debt nor borrows any more money over the 5 yr horizon of the pro formas Debt is assumed unchanged. Stock does not change either (no new stock issuances and no stock repurchases). However, if the firm does not have enough cash it can increase its debt Cash and Mkt Securities is the PLUG. The average balances of cash and marketable securities are assumed to earn 3% interest Depreciation = Depreciation rate * Average fixed assets at cost over the year Interest gain on cash & equivalents = Interest rate on cash & equivalents * Average amount over the year Interest payments on debt = Interest rate on debt * Average debt over the year It is important to use the appropriate the formulas. 2019 2020 2021 2022 2023 2024 2,645 3,042 3,498 4,023 2,000 (1,300) 2,300 (1,495) Year Income statement Sales Costs of goods sold SG&A Interest payments on debt Interest earned on cash & marketable securities Depreciation Profit before tax Taxes Profit after tax Dividends Retained earnings (51) 2 (100) 551 (116) 436 (131) 305 80 300 Balance sheet Cash and marketable securities Current assets Fixed assets At cost Depreciation Net fixed assets Total assets 1,700 (300) 1,400 1,780 160 Current liabilities Debt Stock Accumulated retained earnings Total liabilities and equity 1,020 450 150 1,780