Answered step by step
Verified Expert Solution
Question
1 Approved Answer
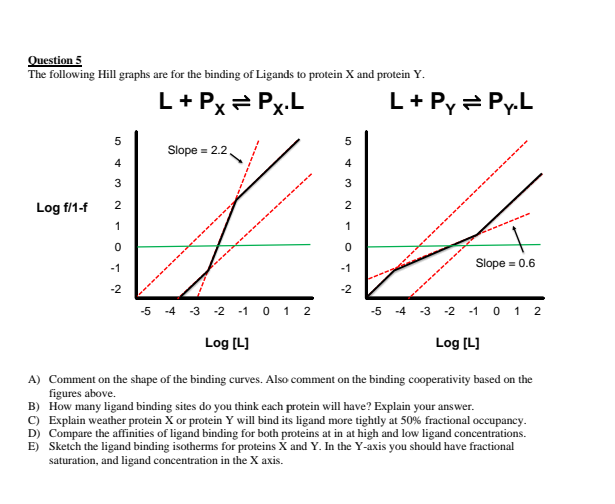
Question 5 The following Hill graphs are for the binding of Ligands to protein X and protein Y. L+Px = Px. L+ Py = PyL

Question 5 The following Hill graphs are for the binding of Ligands to protein X and protein Y. L+Px = Px. L+ Py = PyL 5 5 Slope = 2.2 4 4 3 3 Log f/1-1 2 2 1 1 0 0 -1 -1 Slope = 0.6 -2 -2 -5 -4 -3 -2 -1 0 1 2 -5 -4 -3 -2 -1 0 1 2 Log [L] Log [L] A) Comment on the shape of the binding curves. Also comment on the binding cooperativity based on the figures above. B) How many ligand binding sites do you think each protein will have? Explain your answer. C) Explain weather protein X or protein Y will bind its ligand more tightly at 50% fractional occupancy. D) Compare the affinities of ligand binding for both proteins at in at high and low ligand concentrations. E) Sketch the ligand binding isotherms for proteins X and Y. In the Y-axis you should have fractional saturation, and ligand concentration in the X axis
Step by Step Solution
There are 3 Steps involved in it
Step: 1

Get Instant Access to Expert-Tailored Solutions
See step-by-step solutions with expert insights and AI powered tools for academic success
Step: 2

Step: 3

Ace Your Homework with AI
Get the answers you need in no time with our AI-driven, step-by-step assistance
Get Started


