

Answered step by step
Verified Expert Solution
Question
1 Approved Answer
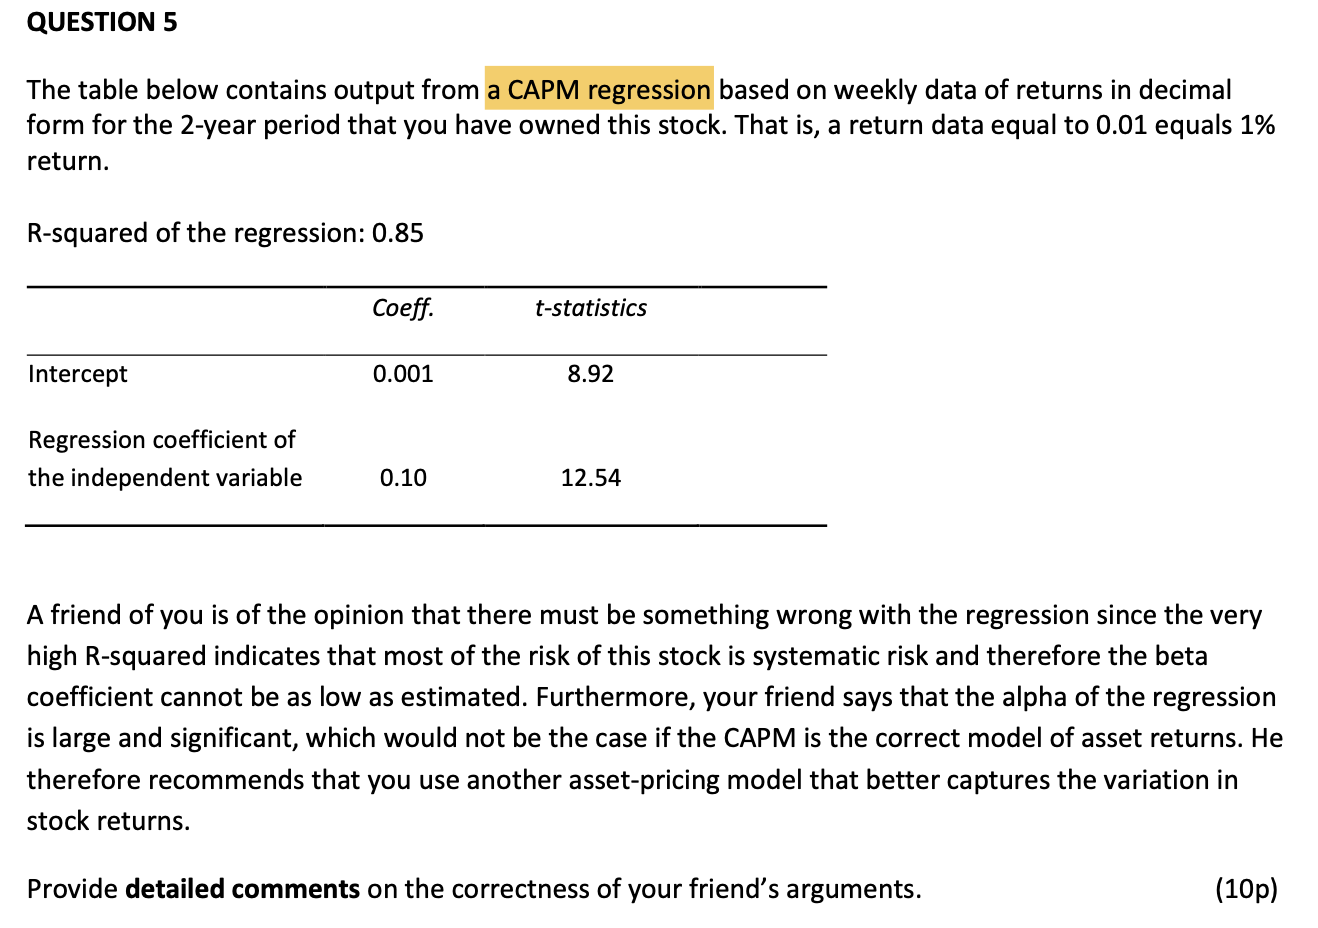
QUESTION 5 The table below contains output from a CAPM regression based on weekly data of returns in decimal form for the 2-year period that
Step by Step Solution
There are 3 Steps involved in it
Step: 1

Get Instant Access to Expert-Tailored Solutions
See step-by-step solutions with expert insights and AI powered tools for academic success
Step: 2

Step: 3
Ace Your Homework with AI
Get the answers you need in no time with our AI-driven, step-by-step assistance
Get Started
Commodity Market Trading And Investment
Authors: Tom James
1st Edition
1137432802, 978-1137432803