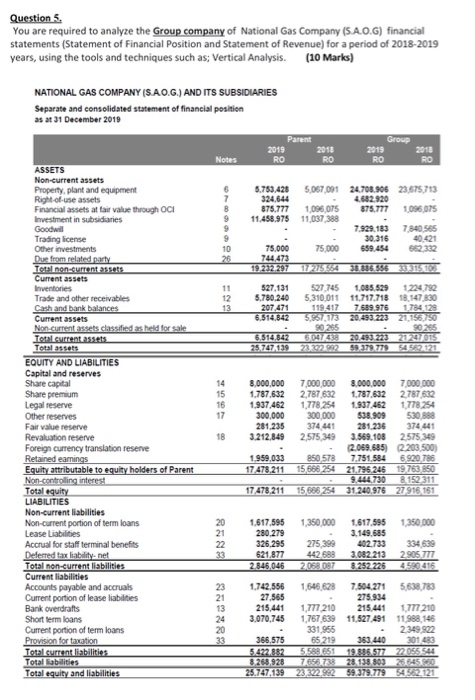
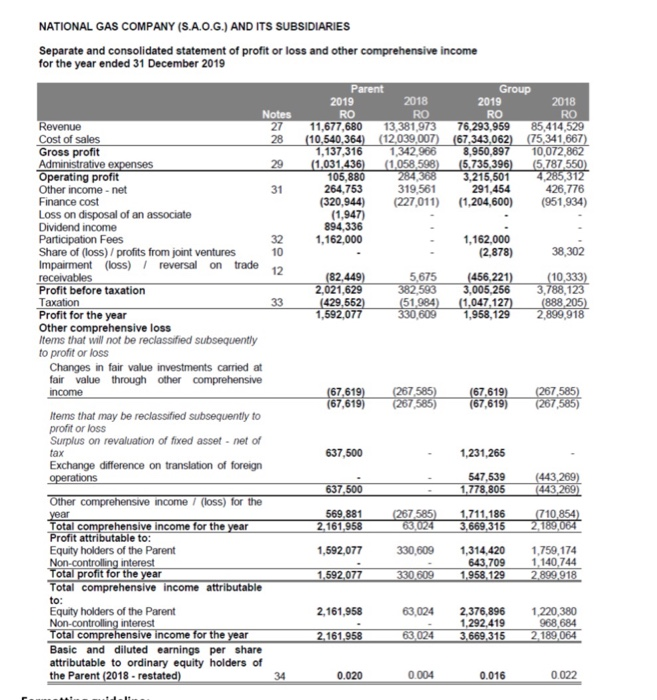
Question 5. You are required to analyze the Group company of National Gas Company (S.A.0.6) financial statements (Statement of Financial Position and Statement of Revenue) for a period of 2018-2019 years, using the tools and techniques such as; Vertical Analysis. (10 Marks) NATIONAL GAS COMPANY (SAO.G.) AND ITS SUBSIDIARIES Separate and consolidated statement of financial position as at 31 December 2018 Parent 2019 RO Notes Group 2015 RO 2018 RO 2018 RO 7 B 5.753,428 5,067,091 24.708.906 23,675,713 324,644 4.682.920 875.777 1.096 075 875.777 1.096 075 11.458.975 11,037,388 7.929. 183 7.840566 30.316 40.421 75,000 75.000 659.454 662 332 744.473 19232 297 10 26 11 12 13 527,131 527 745 1.085.529 1224 792 5.780.240 5,310,011 11.717.718 18.147830 207,471 119.417 7.689.976 1.784.128 6,514,842 5.867.1/3 20.493.223 21.156.750 90265 90265 6.514.842 25.747 1392337298299379.779 54522,021 14 15 16 17 ASSETS Non-current assets Property, plant and equipment Right-of-use assets Financial assets at fair value through OCI Investment in subsidiaries Goodwill Trading license Other investments Due from related party Total non-current assets Current assets Inventories Trade and other receivables Cash and bank balances Current assets Non-current assets classified as held for sale Total current assets Total assets EQUITY AND LIABILITIES Capital and reserves Share capital Share premium Legal reserve Other reserves Fair value reserve Revaluation reserve Foreign currency translation reserve Retained earnings Equity attributable to equity holders of Parent Non-controlling interest Total equity LIABILITIES Non-current liabilities Non-current portion of term loans Lease Liabilities Accrual for staff terminal benefits Deferred tax liability.net Total non-current liabilities Current liabilities Accounts payable and accruals Current portion of lease liabilities Bank overdrafts Short term loans Current portion of term loans Provision for taxation Total current liabilities Total abilities Total equity and liabilities 8,000,000 1.787.632 1.937 462 300,000 281.235 3.212.849 18 7,000,000 8,000,000 7.000.000 2,787 632 1.787.632 2,787632 1,778 254 1.937.462 1,778.254 300,000 $38.909 530,888 374441 281.236 374 441 2,575,349 3.569. 108 2.575 349 (2.069,685 2203,500) 850 578 7.751,584 6,920,786 15 666 254 21.795.246 19,763 950 9.444.730 8,152 311 15.683 254 31 240.976 27916.151 1.959,033 17 478 211 17 478,211 1,350,000 1 350 000 20 21 22 1,617,595 280.279 326,295 621.877 2.845,046 275,399 442.688 2,068087 1.617.595 3.149.685 402.733 3.082.213 3.252.226 334 639 2.905.777 4590 415 23 21 13 24 20 33 1,742,556 27,565 215,441 3,070,745 1,646.628 7.504.271 5,638.783 275.934 1,777210 215.441 1.777.210 1,767,639 11.527 491 11.988.146 331,955 2.349.922 65219 363 440 301 483 5583651 19.885.57722055544 7653733 28 133 803 25.645550 23.322.982 59.379.779 54.562.121 366.575 8268,928 25.747,139 NATIONAL GAS COMPANY (S.A.O.G.) AND ITS SUBSIDIARIES Separate and consolidated statement of profit or loss and other comprehensive income for the year ended 31 December 2019 Parent Group 2019 2018 2019 2018 Notes RO RO RO RO Revenue 27 11,677,680 13,381,973 76,293,959 85,414,529 Cost of sales 28 (10,540,364) (12,039,007) (67,343,062) (75 341,667) Gross profit 1,137,316 1,342,966 8,950,897 10,072,862 Administrative expenses 29 (1,031,436) (1.058 598) (5,735, 396) (5,787 550) Operating profit 105,880 284, 308 3.215,501 4,285,312 Other income-net 31 264,753 319,561 291,454 426,776 Finance cost (320,944) (227,011) (1,204,600) (951,934) Loss on disposal of an associate (1,947) Dividend income 894,336 Participation Fees 32 1,162,000 1,162,000 Share of (loss) profits from joint ventures 10 (2,878) 38,302 Impairment (loss) / reversal on trade 12 receivables (82,449) 5.675 (456,221) (10,333) Profit before taxation 2,021,629 382,593 3,005,256 3,788,123 Taxation 33 (429,552) (51,984) (1,047,127) (888 205) Profit for the year 1,592,077 330,609 1,958,129 2,899,918 Other comprehensive loss Items that will not be reclassified subsequently to profit or loss Changes in fair value investments carried at fair value through other comprehensive income (67,619) (267 585) (67,619) (267,585) (67,619) (267,585) (67,619) (267,585) Items that may be reclassified subsequently to Surplus on revaluation of fixed asset - net of tax 637,500 1,231,265 Exchange difference on translation of foreign operations 547,539 (443,269) 637,500 1,778,805 (443,269) Other comprehensive income / (loss) for the year 569.881 (267585) 1.711,186 710,854) Total comprehensive income for the year 2,161,958 63,024 3,669,315 2,189,064 Profit attributable to: Equity holders of the Parent 1,592,077 330,609 1,314,420 1,759,174 Non-controlling interest 643,709 1,140, 744 Total profit for the year 1,592 077 330.609 1.958, 129 2899.918 Total comprehensive income attributable to: Equity holders of the Parent 2,161,958 63,024 2,376,896 1,220,380 Non-controlling interest 1,292,419 968,684 Total comprehensive income for the year 2,161,958 63,024 3.669,315 2 189,064 Basic and diluted earnings per share attributable to ordinary equity holders of the Parent (2018. restated) 34 0.020 0.004 0.016 0.022