Question 5-10 please
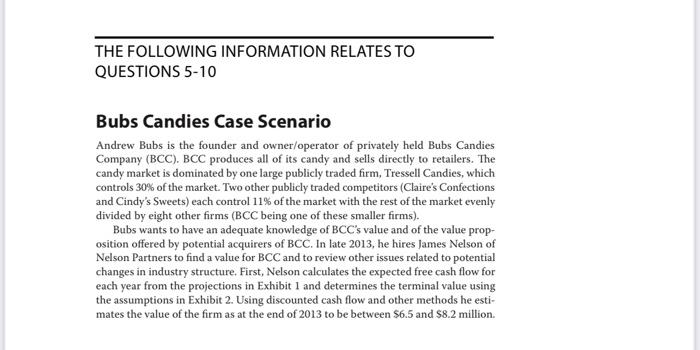
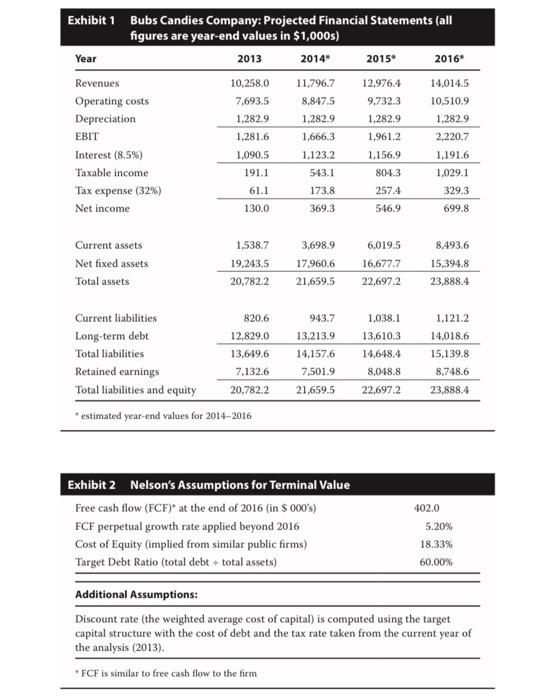
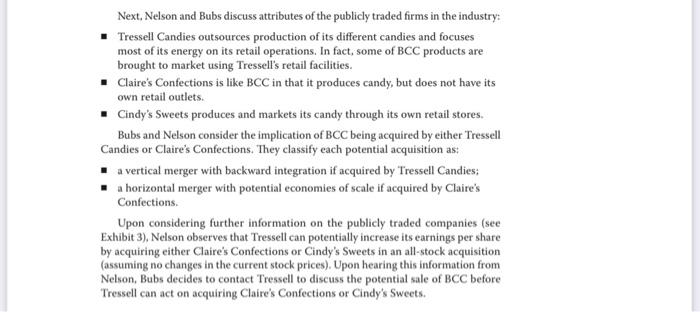
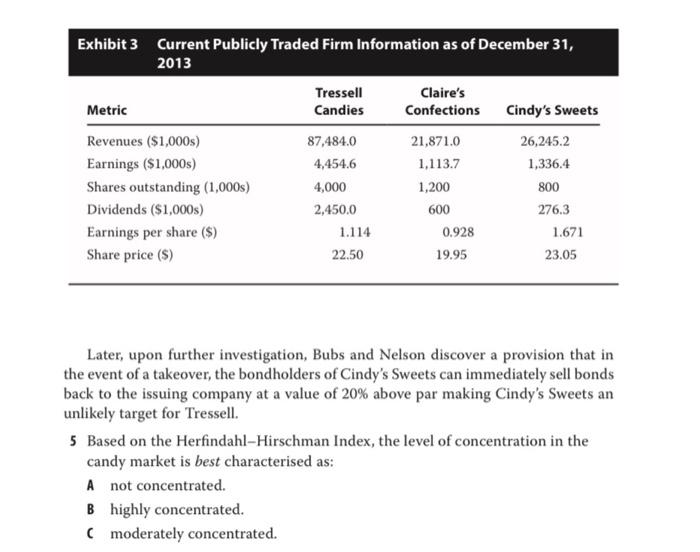
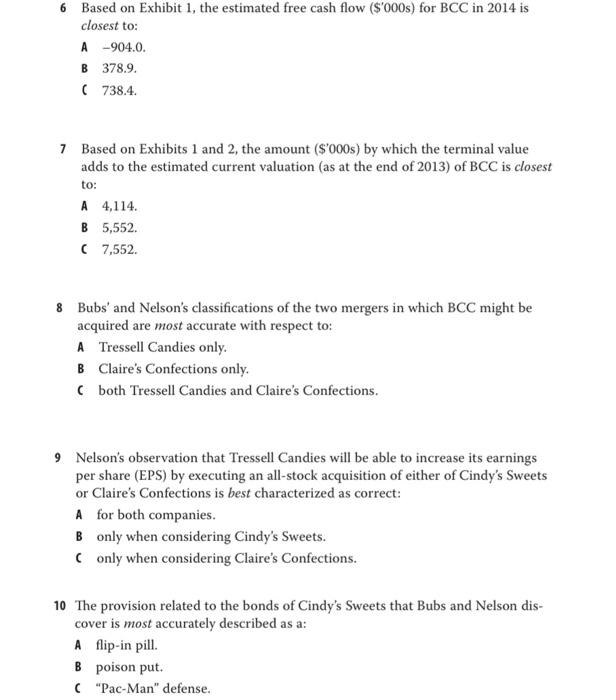
THE FOLLOWING INFORMATION RELATES TO QUESTIONS 5-10 Bubs Candies Case Scenario Andrew Bubs is the founder and owner/operator of privately held Bubs Candies Company (BCC). BCC produces all of its candy and sells directly to retailers. The candy market is dominated by one large publicly traded firm, Tressell Candies, which controls 30% of the market. Two other publicly traded competitors (Claire's Confections and Cindy's Sweets) each control 11% of the market with the rest of the market evenly divided by eight other firms (BCC being one of these smaller firms). Bubs wants to have an adequate knowledge of BCC's value and of the value prop- osition offered by potential acquirers of BCC. In late 2013, he hires James Nelson of Nelson Partners to find a value for BCC and to review other issues related to potential changes in industry structure. First, Nelson calculates the expected free cash flow for each year from the projections in Exhibit 1 and determines the terminal value using the assumptions in Exhibit 2. Using discounted cash flow and other methods he esti- mates the value of the firm as at the end of 2013 to be between $6.5 and 58.2 million Exhibit 1 Bubs Candies Company: Projected Financial Statements (all figures are year-end values in $1,000s) Year 2013 2014" 2015 2016* Revenues 10,258.0 11,796.7 12,976.4 14,014.5 Operating costs 7,693.5 8,847.5 9,732.3 10,510.9 Depreciation 1,282.9 1,282.9 1.282.9 1.282.9 EBIT 1.2816 1.666.3 1,961.2 2,220.7 Interest (8,5%) 1,090.5 1,123.2 1.156.9 1,191.6 Taxable income 191.1 543.1 804.3 1,029.1 Tax expense (32%) 61.1 173.8 257.4 329.3 Net income 130.0 369.3 546.9 699.8 3,698.9 6,019.5 Current assets Net fixed assets Total assets 1,538.7 19,243.5 17,960.6 21,659.5 16,677.7 22,697.2 8,493.6 15,394.8 23,888.4 20,782.2 Current liabilities 820.6 Long-term debt 12,829.0 Total liabilities 13,649.6 Retained earnings 7.132.6 Total liabilities and equity 20,782.2 * estimated year-end values for 2014-2016 943.7 13,213.9 14.157.6 7,501.9 21.659.5 1,038.1 13,610.3 14,648.4 8,048.8 22,697.2 1,121.2 14,018.6 15,139.8 8,748.6 23,888.4 Exhibit 2 Nelson's Assumptions for Terminal Value Free cash flow (FCF) at the end of 2016 (in S 000's) FCF perpetual growth rate applied beyond 2016 Cost of Equity (implied from similar public firms) Target Debt Ratio (total debt + total assets) 402.0 5.20% 18.33% 60.00% Additional Assumptions: Discount rate (the weighted average cost of capital) is computed using the target capital structure with the cost of debt and the tax rate taken from the current year of the analysis (2013). FCF is similar to free cash flow to the firm Next, Nelson and Bubs discuss attributes of the publicly traded firms in the industry Tressell Candies outsources production of its different candies and focuses most of its energy on its retail operations. In fact, some of BCC products are brought to market using Tressell's retail facilities. Claire's Confections is like BCC in that it produces candy, but does not have its own retail outlets. Cindy's Sweets produces and markets its candy through its own retail stores. Bubs and Nelson consider the implication of BCC being acquired by either Tressell Candies or Claire's Confections. They classify each potential acquisition as: a vertical merger with backward integration if acquired by Tressell Candies: a horizontal merger with potential economies of scale if acquired by Claire's Confections Upon considering further information on the publicly traded companies (see Exhibit 3), Nelson observes that Tressell can potentially increase its earnings per share by acquiring either Claire's Confections or Cindy's Sweets in an all-stock acquisition (assuming no changes in the current stock prices). Upon hearing this information from Nelson, Bubs decides to contact Tressell to discuss the potential sale of BCC before Tressell can act on acquiring Claire's Confections or Cindy's Sweets. Exhibit 3 Current Publicly Traded Firm Information as of December 31, 2013 Tressell Claire's Metric Candies Confections Cindy's Sweets Revenues ($1,000s) 87,484.0 21,871.0 26,245.2 Earnings ($1,000s) 4,454.6 1.113.7 1,336.4 Shares outstanding (1,000s) 4,000 1,200 800 Dividends ($1,000s) 2,450.0 600 276.3 Earnings per share ($) 1.114 0.928 1.671 Share price (s) 22.50 19.95 23.05 Later, upon further investigation, Bubs and Nelson discover a provision that in the event of a takeover, the bondholders of Cindy's Sweets can immediately sell bonds back to the issuing company at a value of 20% above par making Cindy's Sweets an unlikely target for Tressell. 5 Based on the Herfindahl-Hirschman Index, the level of concentration in the candy market is best characterised as: A not concentrated. B highly concentrated. (moderately concentrated. 6 Based on Exhibit 1, the estimated free cash flow ($'000s) for BCC in 2014 is closest to: A-904.0. B 378.9. (738.4. 7 Based on Exhibits 1 and 2, the amount ($'000s) by which the terminal value adds to the estimated current valuation (as at the end of 2013) of BCC is closest to: A 4,114. B 5,552 (7,552. 8 Bubs' and Nelson's classifications of the two mergers in which BCC might be acquired are most accurate with respect to: A Tressell Candies only. B Claire's Confections only. (both Tressell Candies and Claire's Confections. 9 Nelson's observation that Tressell Candies will be able to increase its earnings per share (EPS) by executing an all-stock acquisition of either of Cindy's Sweets or Claire's Confections is best characterized as correct: A for both companies. B only when considering Cindy's Sweets. (only when considering Claire's Confections. 10 The provision related to the bonds of Cindy's Sweets that Bubs and Nelson dis- cover is most accurately described as a: A flip-in pill. B poison put. ("Pac-Man" defense


