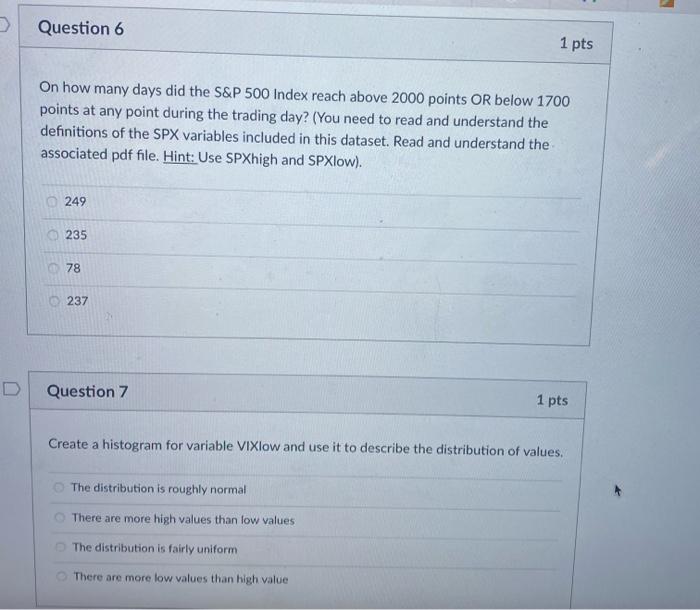
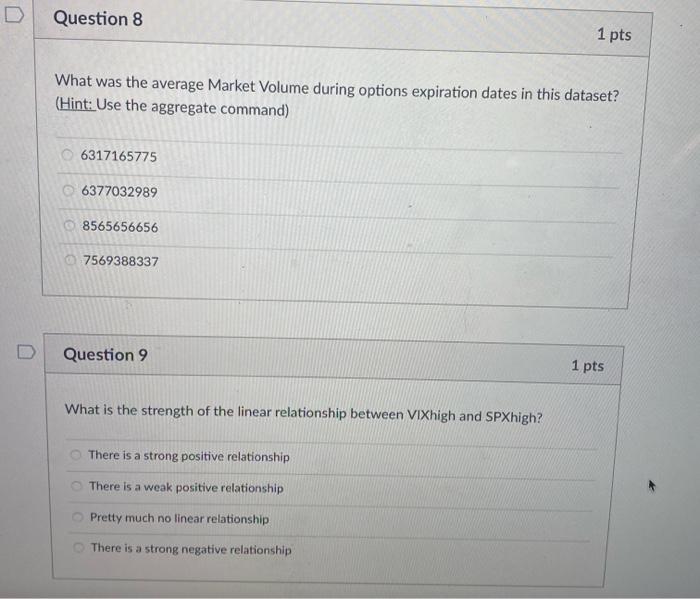
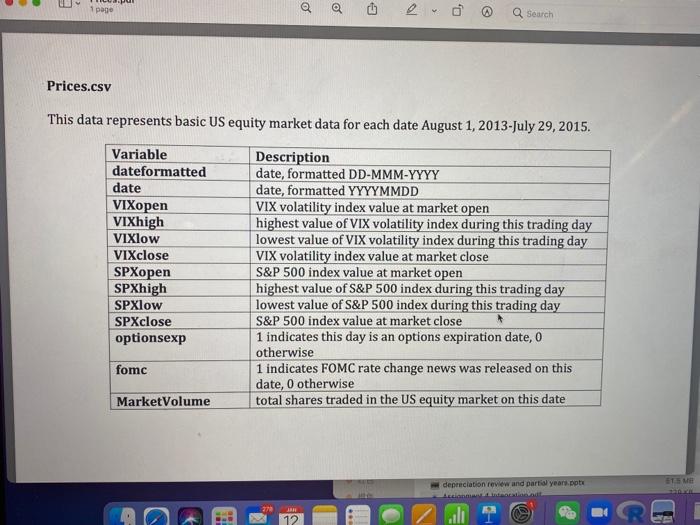
Question 6 1 pts On how many days did the S&P 500 Index reach above 2000 points OR below 1700 points at any point during the trading day? (You need to read and understand the definitions of the SPX variables included in this dataset. Read and understand the associated pdf file. Hint: Use SPXhigh and SPXlow). 249 235 78 237 Question 7 1 pts Create a histogram for variable VIXlow and use it to describe the distribution of values, The distribution is roughly normal There are more high values than low values The distribution is fairly uniform There are more low values than high value D Question 8 1 pts What was the average Market Volume during options expiration dates in this dataset? (Hint: Use the aggregate command) 6317165775 6377032989 8565656656 7569388337 D Question 9 1 pts What is the strength of the linear relationship between VIXhigh and SPXhigh? There is a strong positive relationship There is a weak positive relationship Pretty much no linear relationship There is a strong negative relationship 1 page o Q Search Prices.csv This data represents basic US equity market data for each date August 1, 2013-July 29, 2015. Variable dateformatted date VIXopen VIXhigh VIXlow VIXclose SPXopen SPXhigh SPXlow SPXclose optionsexp Description date, formatted DD-MMM-YYYY date, formatted YYYYMMDD VIX volatility index value at market open highest value of VIX volatility index during this trading day lowest value of VIX volatility index during this trading day VIX volatility index value at market close S&P 500 index value at market open highest value of S&P 500 index during this trading day lowest value of S&P 500 index during this trading day S&P 500 index value at market close 1 indicates this day is an options expiration date, O otherwise 1 indicates FOMC rate change news was released on this date, 0 otherwise total shares traded in the US equity market on this date fomc MarketVolume ET depreciation review and partial years.ppt 27 ARH li Question 6 1 pts On how many days did the S&P 500 Index reach above 2000 points OR below 1700 points at any point during the trading day? (You need to read and understand the definitions of the SPX variables included in this dataset. Read and understand the associated pdf file. Hint: Use SPXhigh and SPXlow). 249 235 78 237 Question 7 1 pts Create a histogram for variable VIXlow and use it to describe the distribution of values, The distribution is roughly normal There are more high values than low values The distribution is fairly uniform There are more low values than high value D Question 8 1 pts What was the average Market Volume during options expiration dates in this dataset? (Hint: Use the aggregate command) 6317165775 6377032989 8565656656 7569388337 D Question 9 1 pts What is the strength of the linear relationship between VIXhigh and SPXhigh? There is a strong positive relationship There is a weak positive relationship Pretty much no linear relationship There is a strong negative relationship 1 page o Q Search Prices.csv This data represents basic US equity market data for each date August 1, 2013-July 29, 2015. Variable dateformatted date VIXopen VIXhigh VIXlow VIXclose SPXopen SPXhigh SPXlow SPXclose optionsexp Description date, formatted DD-MMM-YYYY date, formatted YYYYMMDD VIX volatility index value at market open highest value of VIX volatility index during this trading day lowest value of VIX volatility index during this trading day VIX volatility index value at market close S&P 500 index value at market open highest value of S&P 500 index during this trading day lowest value of S&P 500 index during this trading day S&P 500 index value at market close 1 indicates this day is an options expiration date, O otherwise 1 indicates FOMC rate change news was released on this date, 0 otherwise total shares traded in the US equity market on this date fomc MarketVolume ET depreciation review and partial years.ppt 27 ARH li