Answered step by step
Verified Expert Solution
Link Copied!

Question

1 Approved Answer

Question 6 [21] Suppose the government introduces a production (output) tax on luxury motor vehicles in South Africa. The average selling price of these motor

Question 6 [21]

Suppose the government introduces a production (output) tax on luxury motor vehicles in South Africa. The average selling price of these motor vehicles is R380 000. The amount of tax introduced is R30 000.

6.1. Will the price elasticity of demand for luxury motor vehicles in this scenario be equal to one, greater than one or zero? (1)

6.2. Use the diagram below to discuss and/or indicate the following:

6.2.1. The elasticity of the demand curve (1)

6.2.2. The original price and quantity, and point of equilibrium (2)

6.2.3. The area representing the consumer surplus before tax (1)

6.2.4. The area representing the producer surplus before tax (1)

6.2.5. The effect of the tax on production on the supply curve and the new equilibrium price and quantity for the consumer (2)

6.2.6. The new price that the producer will receive (1)

6.2.7. The areas on the graph (rectangles) which indicate the burdens of the tax for the producer and the consumer (Explain why the tax burden of either the producer or the consumer is larger than the other.) (3)

6.2.8. The areas on the graph which indicate surplus areas after tax for the consumer and the producer (1)

6.2.9. The triangles which represent the dead-weight loss areas (1)
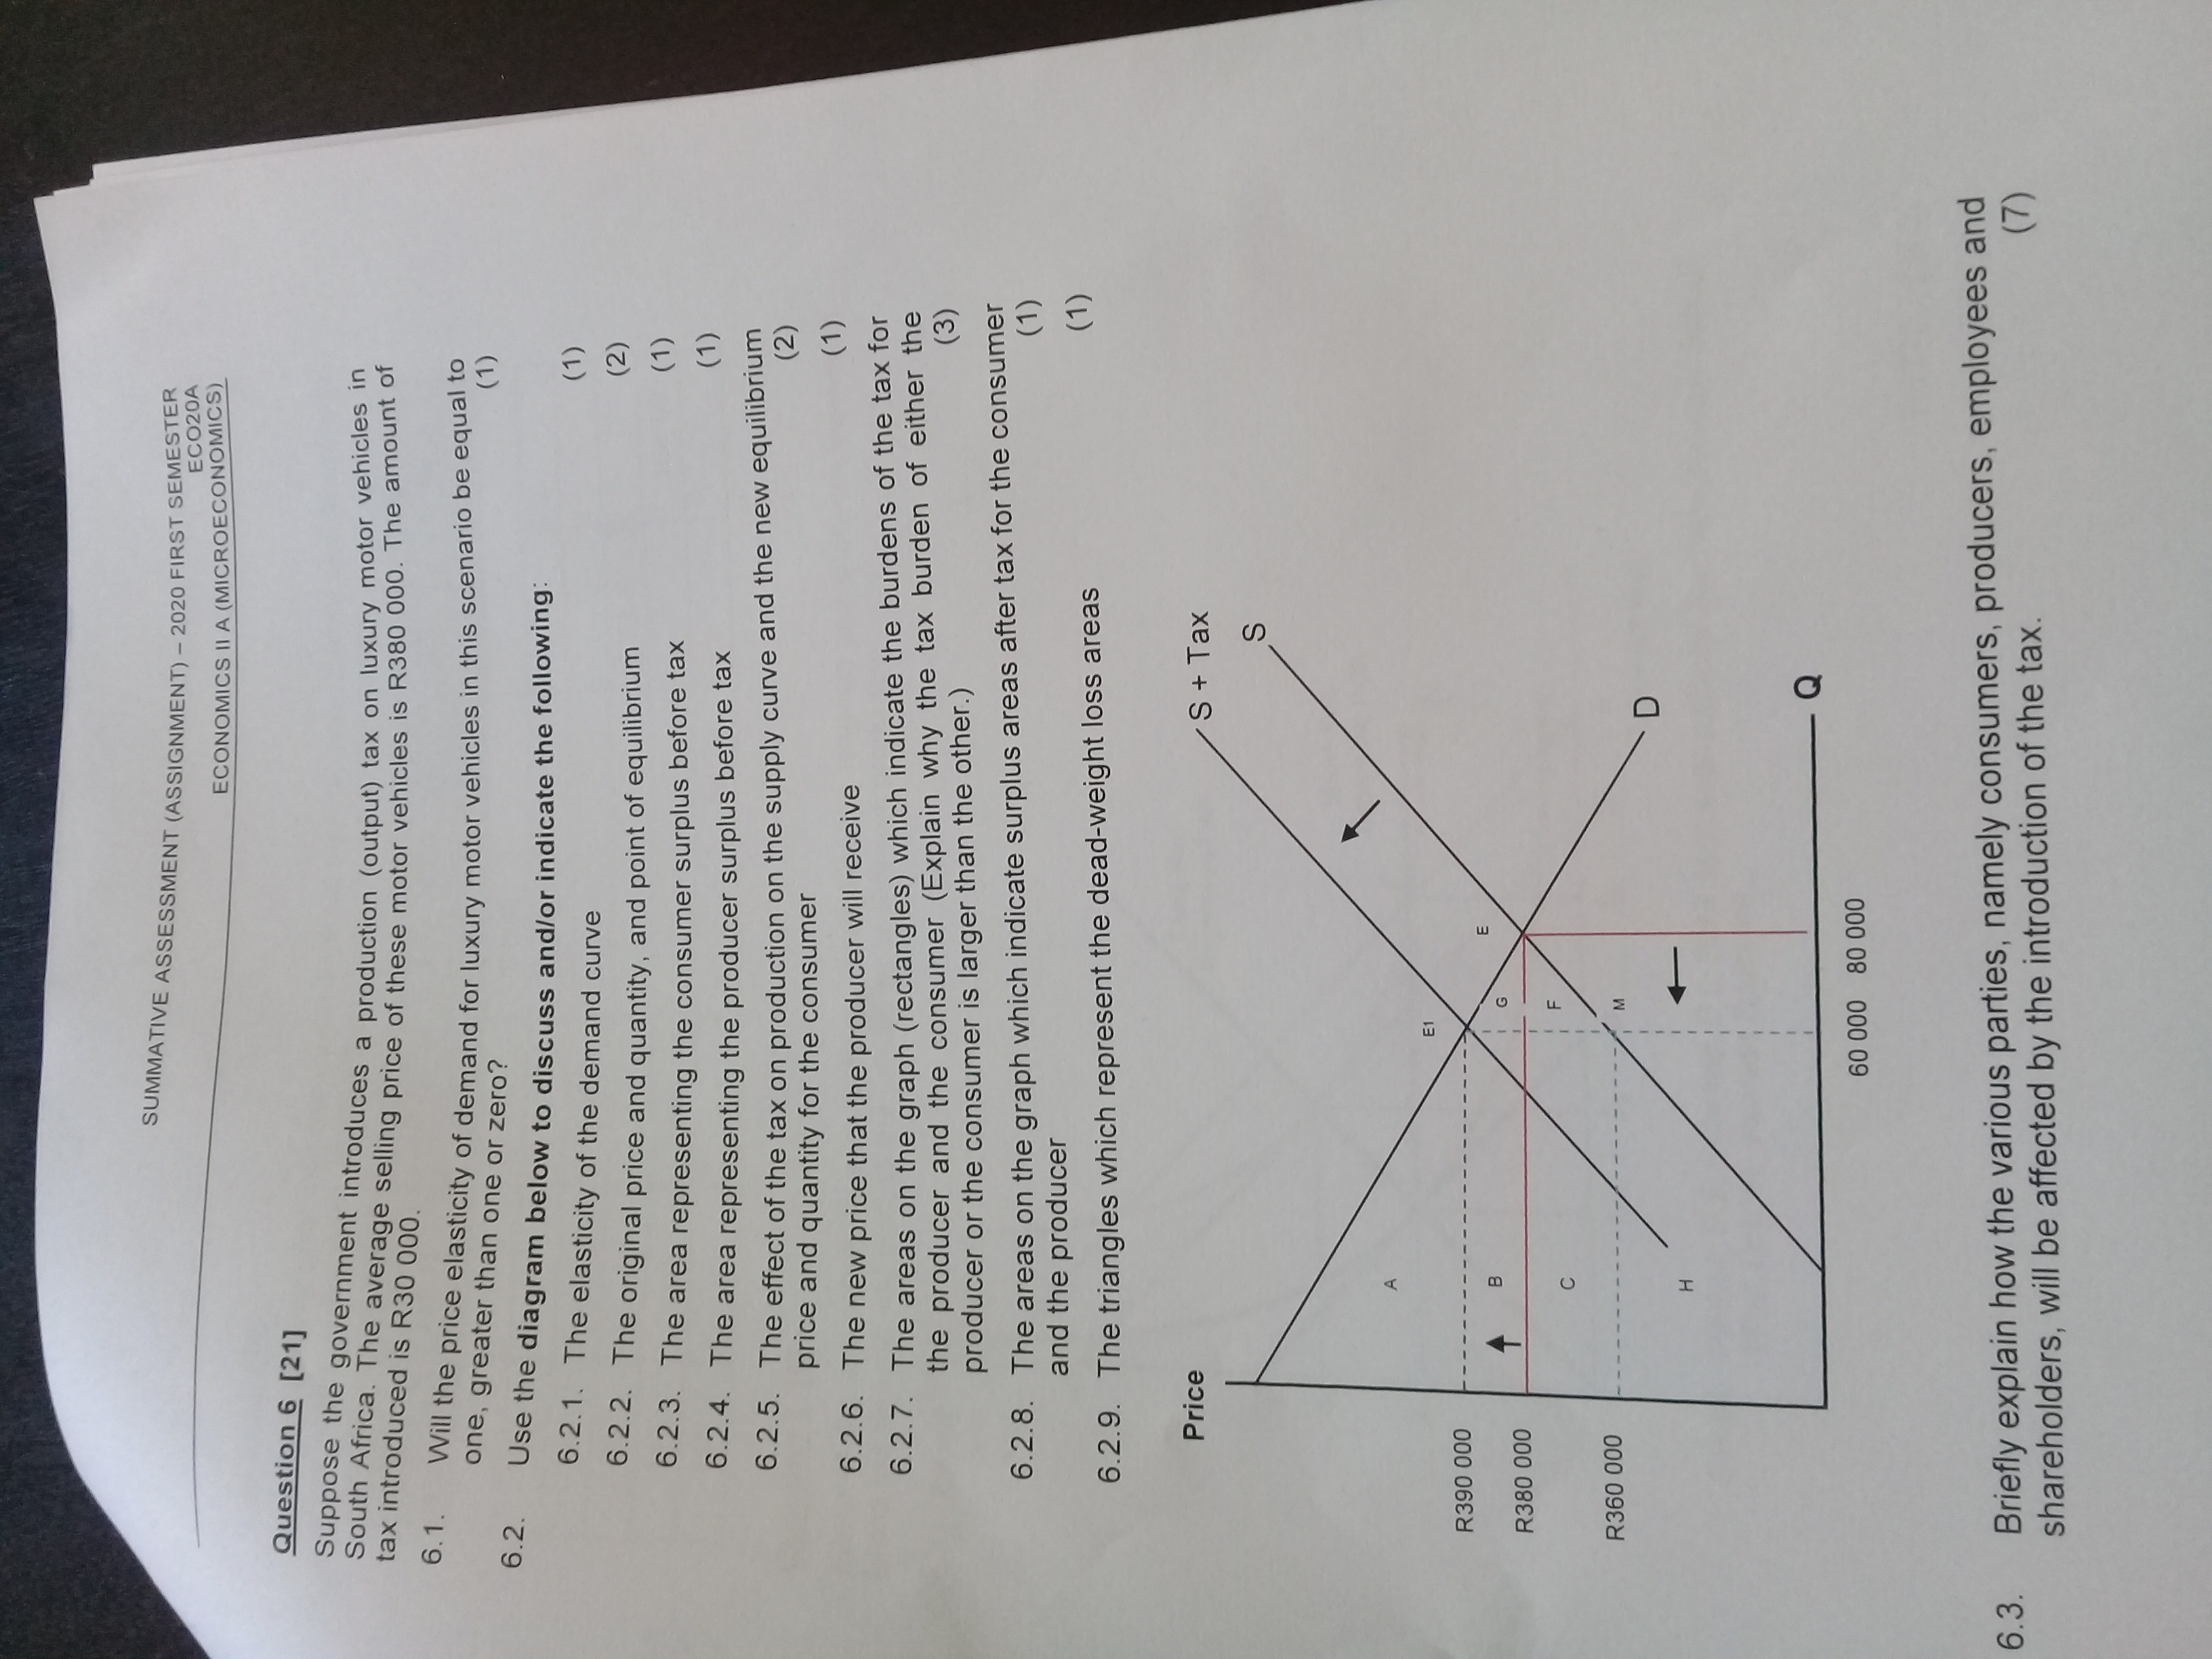
image text in transcribed
SUMMATIVE ASSESSMENT (ASSIGNMENT) - 2020 FIRST SEMESTER ECO20A ECONOMICS II A (MICROECONOMICS) Question 6 [21] Suppose the government introduces a production (output) tax on luxury motor vehicles in South Africa. The average selling price of these motor vehicles is R380 000. The amount of tax introduced is R30 000. 6.1 . Will the price elasticity of demand for luxury motor vehicles in this scenario be equal to 6.2. one, greater than one or zero? (1) Use the diagram below to discuss and/or indicate the following: 6.2.1. The elasticity of the demand curve (1) 6.2.2. The original price and quantity, and point of equilibrium ( 2 ) 6.2.3. The area representing the consumer surplus before tax ( 1 ) 6.2.4. The area representing the producer surplus before tax ( 1 ) 6.2.5. The effect of the tax on production on the supply curve and the new equilibrium price and quantity for the consumer (2) 6.2.6. The new price that the producer will receive (1) 6.2.7. The areas on the graph (rectangles) which indicate the burdens of the tax for the producer and the consumer (Explain why the tax burden of either the producer or the consumer is larger than the other.) (3) 6.2.8. The areas on the graph which indicate surplus areas after tax for the consumer and the producer (1) 6.2.9. The triangles which represent the dead-weight loss areas ( 1 ) Price S + Tax S A E1 R390 000 B R380 000 G C R360 000 D H Q 60 000 80 000 6.3. Briefly explain how the various parties, namely consumers, producers, employees and shareholders, will be affected by the introduction of the tax. (7)

Step by Step Solution

There are 3 Steps involved in it

Step: 1

blur-text-image

Get Instant Access to Expert-Tailored Solutions

See step-by-step solutions with expert insights and AI powered tools for academic success

Step: 2

blur-text-image

Step: 3

blur-text-image

Ace Your Homework with AI

Get the answers you need in no time with our AI-driven, step-by-step assistance

Get Started

Recommended Textbook for

International economics

Authors: Robert J. Carbaugh

13th Edition

978-1439038949, 1439038945, 978-8131518823

More Books

Students also viewed these Economics questions

Question

How will a plan contribute to goal achievement?

Answered: 1 week ago

Question

Explain the various methods of job evaluation

Answered: 1 week ago

Question

Differentiate Personnel Management and Human Resource Management

Answered: 1 week ago

Question

Describe the functions of Human resource management

Answered: 1 week ago