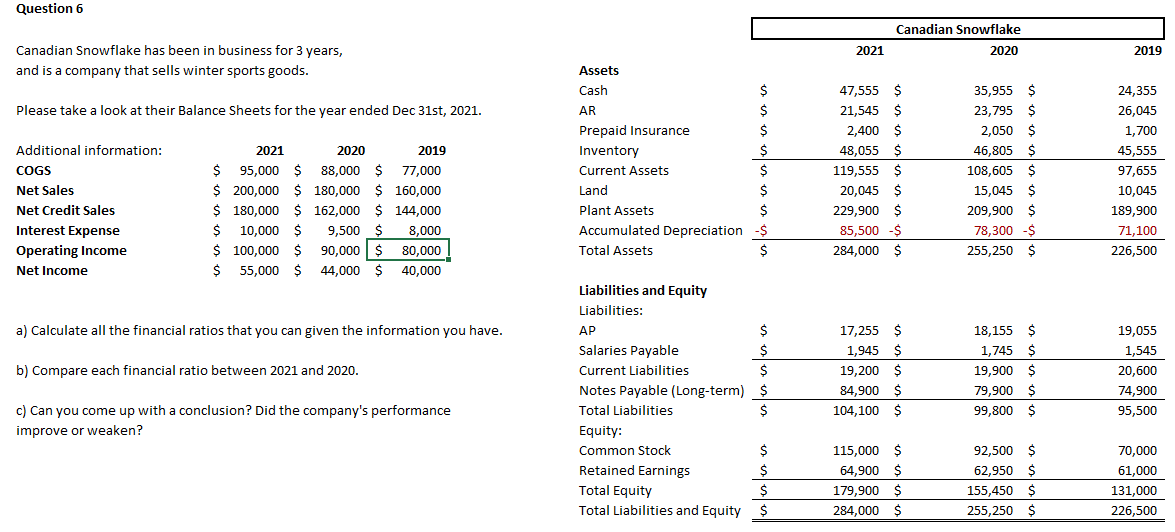
Question 6 Canadian Snowflake 2020 2021 2019 Canadian Snowflake has been in business for 3 years, and is a company that sells winter sports goods. Please take a look at their Balance Sheets for the year ended Dec 31st, 2021. Additional information: COGS Net Sales Net Credit Sales Interest Expense Operating Income Net Income 2021 2020 2019 $ 95,000 $ 88,000 $ 77,000 $ 200,000 $ 180,000 $ 160,000 $ 180,000 $ 162,000 $144,000 $ 10,000 $ 9,500 $ 8,000 $ 100,000 $ 90,000 $80,000 $ 55,000 $ 44,000 $ 40,000 Assets Cash S AR $ Prepaid Insurance $ Inventory $ Current Assets $ Land $ Plant Assets $ Accumulated Depreciation -$ Total Assets $ 47,555 $ 21,545 $ 2,400 $ 48,055 $ 119,555 $ 20,045 $ 229,900 $ 85,500 $ 284,000 $ 35,955 $ 23,795 $ 2,050 $ 46,805 $ 108,605 $ 15,045 $ 209,900 $ 78,300 $ 255,250 $ 24,355 26,045 1,700 45,555 97,655 10,045 189,900 71,100 226,500 a) Calculate all the financial ratios that you can given the information you have. b) Compare each financial ratio between 2021 and 2020. Liabilities and Equity Liabilities: AP $ Salaries Payable $ Current Liabilities $ $ Notes Payable (Long-term) $ Total Liabilities $ Equity: Common Stock $ Retained Earnings $ Total Equity $ Total Liabilities and Equity $ 17,255 $ 1,945 $ 19,200 $ 84,900 $ 104,100 $ 18,155 $ 1,745 $ 19,900 $ 79,900 $ 99,800 $ 19,055 1,545 20,600 74,900 95,500 c) Can you come up with a conclusion? Did the company's performance improve or weaken? 115,000 $ 64,900 $ 179,900 $ 284,000 $ 92,500 $ 62,950 $ 155,450 $ 255,250 $ 70,000 61,000 131,000 226,500 Question 6 Canadian Snowflake 2020 2021 2019 Canadian Snowflake has been in business for 3 years, and is a company that sells winter sports goods. Please take a look at their Balance Sheets for the year ended Dec 31st, 2021. Additional information: COGS Net Sales Net Credit Sales Interest Expense Operating Income Net Income 2021 2020 2019 $ 95,000 $ 88,000 $ 77,000 $ 200,000 $ 180,000 $ 160,000 $ 180,000 $ 162,000 $144,000 $ 10,000 $ 9,500 $ 8,000 $ 100,000 $ 90,000 $80,000 $ 55,000 $ 44,000 $ 40,000 Assets Cash S AR $ Prepaid Insurance $ Inventory $ Current Assets $ Land $ Plant Assets $ Accumulated Depreciation -$ Total Assets $ 47,555 $ 21,545 $ 2,400 $ 48,055 $ 119,555 $ 20,045 $ 229,900 $ 85,500 $ 284,000 $ 35,955 $ 23,795 $ 2,050 $ 46,805 $ 108,605 $ 15,045 $ 209,900 $ 78,300 $ 255,250 $ 24,355 26,045 1,700 45,555 97,655 10,045 189,900 71,100 226,500 a) Calculate all the financial ratios that you can given the information you have. b) Compare each financial ratio between 2021 and 2020. Liabilities and Equity Liabilities: AP $ Salaries Payable $ Current Liabilities $ $ Notes Payable (Long-term) $ Total Liabilities $ Equity: Common Stock $ Retained Earnings $ Total Equity $ Total Liabilities and Equity $ 17,255 $ 1,945 $ 19,200 $ 84,900 $ 104,100 $ 18,155 $ 1,745 $ 19,900 $ 79,900 $ 99,800 $ 19,055 1,545 20,600 74,900 95,500 c) Can you come up with a conclusion? Did the company's performance improve or weaken? 115,000 $ 64,900 $ 179,900 $ 284,000 $ 92,500 $ 62,950 $ 155,450 $ 255,250 $ 70,000 61,000 131,000 226,500