Question 6
Cindy consumes goods x and y. Her demand for x is given by x(Px, m) = 0.05m - 5.15Px. Now her income is 419, the price of x is 3, and the price of y is 1. If the price of x rises to 4 and if we denote the income effect on her demand for x by DI and the substitution effect on her demand for x by DS
(a) DI = -0.28 and DS = -0.52.
(b) DI = -0.28 and DS = -4.88.
(c) DI = -0.52 and DS = -0.52.
(d) DI = 0 and DS = -2.00.
(e) None of the above.
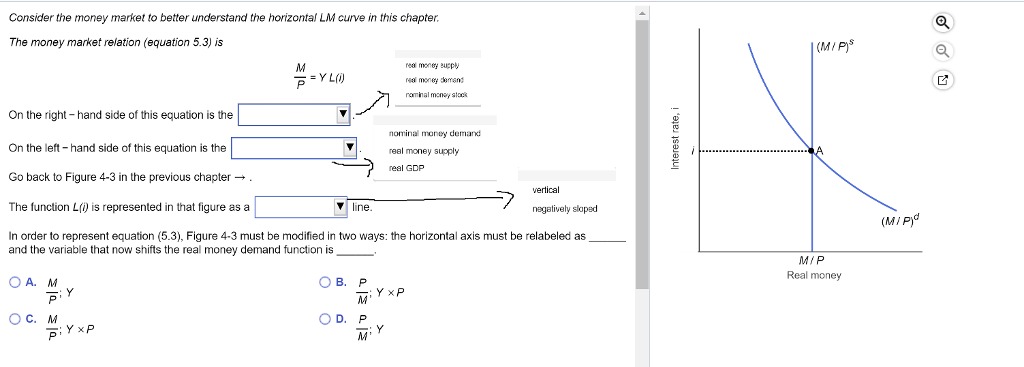
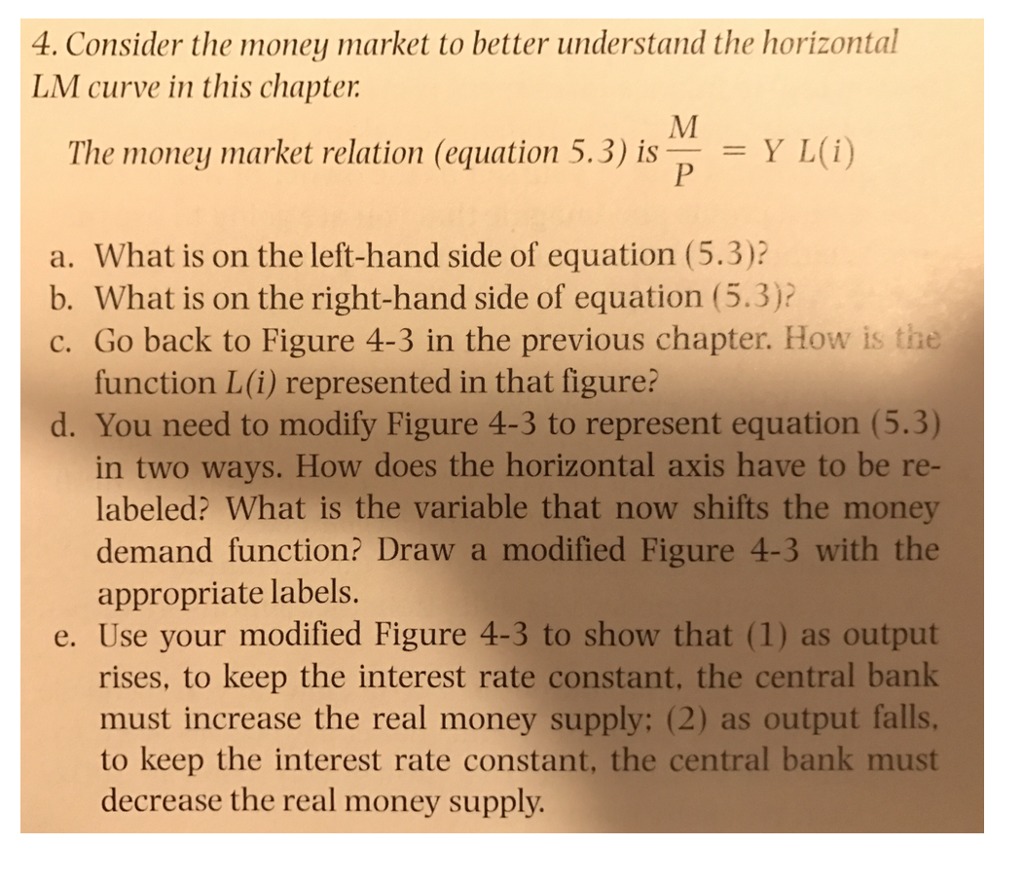
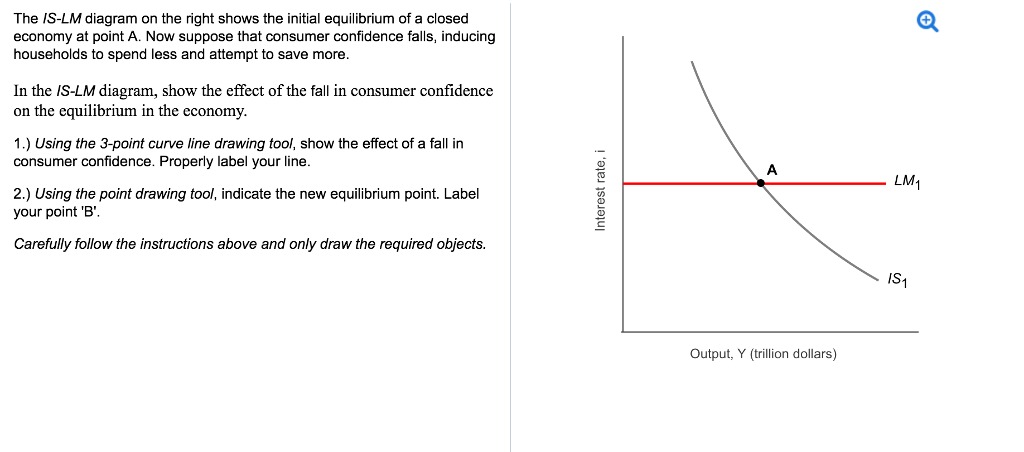
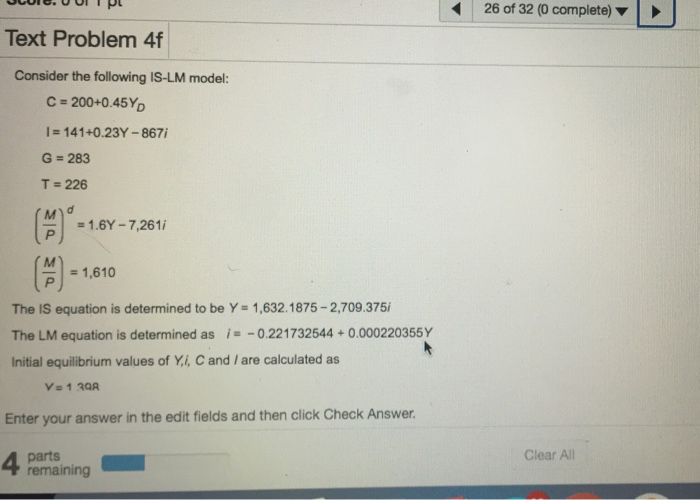
Consider the money market to better understand the horizontal LM curve in this chapter. The money market relation (equation 5.3) is (M/ P)S M real money susply - = YL() No money demand nominal money stock On the right - hand side of this equation is the nomini money demand Interest rate, i On the left - hand side of this equation is the real money supply A real GDP Go back to Figure 4-3 in the previous chapter - . vertical The function L(0) is represented in that figure as a line. negatively slaped (M/Aid In order to represent equation (5.3), Figure 4-3 must be modified in two ways: the horizontal axis must be relabeled as and the variable that now shifts the real money demand function is M/P OA. M OB. P Real money DIY :Y XP OC. M OD. P piY XP4. Consider the money market to better understand the horizontal LM curve in this chapter. M The money market relation (equation 5.3) is P = Y L(i) a. What is on the left-hand side of equation (5.3)? b. What is on the right-hand side of equation (5.3)? c. Go back to Figure 4-3 in the previous chapter. How is the function L(i) represented in that figure? d. You need to modify Figure 4-3 to represent equation (5.3) in two ways. How does the horizontal axis have to be re- labeled? What is the variable that now shifts the money demand function? Draw a modified Figure 4-3 with the appropriate labels. e. Use your modified Figure 4-3 to show that (1) as output rises, to keep the interest rate constant, the central bank must increase the real money supply; (2) as output falls, to keep the interest rate constant, the central bank must decrease the real money supply.The /S-LM diagram on the right shows the initial equilibrium of a closed + economy at point A. Now suppose that consumer confidence falls, inducing households to spend less and attempt to save more. In the /S-LM diagram, show the effect of the fall in consumer confidence on the equilibrium in the economy. 1.) Using the 3-point curve line drawing tool, show the effect of a fall in consumer confidence. Properly label your line. A LM1 2.) Using the point drawing tool, indicate the new equilibrium point. Label Interest rate, i your point 'B'. Carefully follow the instructions above and only draw the required objects. IS1 Output, Y (trillion dollars)26 of 32 (0 complete) Text Problem 4f Consider the following IS-LM model: C = 200+0.45YD 1 = 141+0.23Y -867/ G = 283 T = 226 M d = 1.6Y -7,261/ M P = 1,610 The IS equation is determined to be Y = 1,632.1875 - 2,709.375/ The LM equation is determined as /= - 0.221732544 + 0.000220355Y Initial equilibrium values of Y,i, C and / are calculated as V = 1 30A Enter your answer in the edit fields and then click Check Answer. 4 parts Clear All remaining
