

Answered step by step
Verified Expert Solution
Question
1 Approved Answer
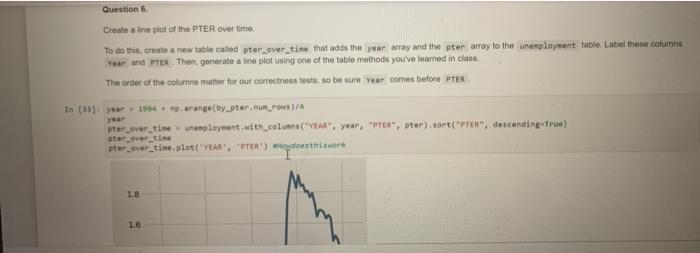
Question 6. Create a line plot of the PTER over time. To do this create a new table called pter_over_time that adds the year array

Step by Step Solution
There are 3 Steps involved in it
Step: 1

Get Instant Access to Expert-Tailored Solutions
See step-by-step solutions with expert insights and AI powered tools for academic success
Step: 2

Step: 3
Ace Your Homework with AI
Get the answers you need in no time with our AI-driven, step-by-step assistance
Get Started
DATABASE Administrator Make A Difference
Authors: Mohciine Elmourabit
1st Edition
B0CGM7XG75, 978-1722657802