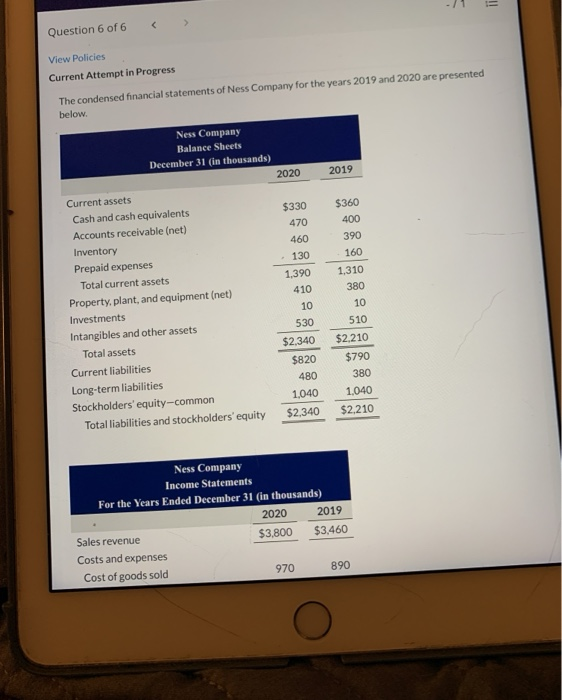
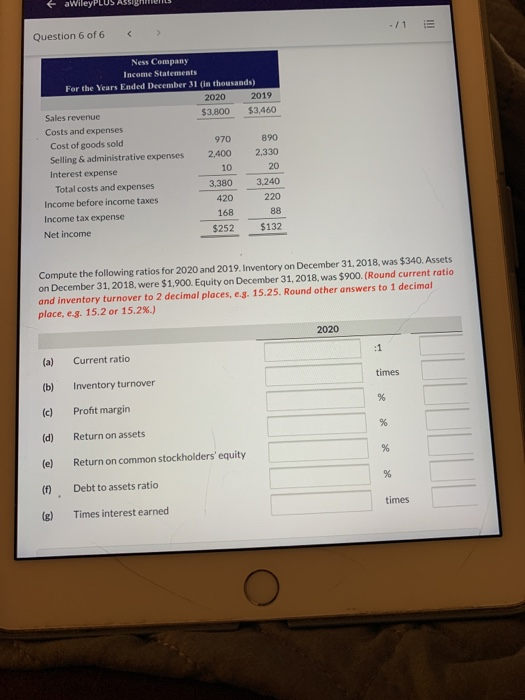
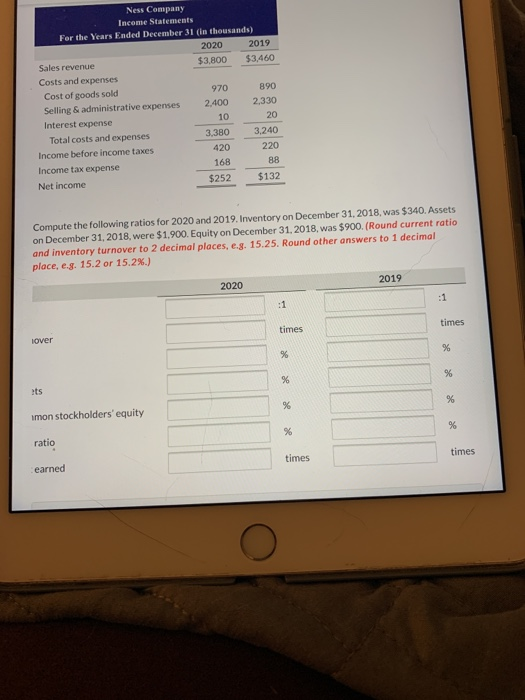
!! Question 6 of 6 View Policies Current Attempt in Progress The condensed financial statements of Ness Company for the years 2019 and 2020 are presented below. Ness Company Balance Sheets December 31 (in thousands) 2020 2019 $330 470 460 130 Current assets Cash and cash equivalents Accounts receivable (net) Inventory Prepaid expenses Total current assets Property, plant, and equipment (net) Investments Intangibles and other assets Total assets Current liabilities Long-term liabilities Stockholders' equity-common Total liabilities and stockholders' equity 1,390 410 10 530 $2.340 $360 400 390 160 1,310 380 10 510 $2.210 $790 380 1.040 $2.210 $820 480 1,040 $2.340 Ness Company Income Statements For the Years Ended December 31 (in thousands) 2020 2019 Sales revenue $3,800 $3.460 Costs and expenses Cost of goods sold 970 890 a WileyPLUS -/1 Question 6 of 6 Ness Company Income Statements For the Years Ended December 31 (in thousands) 2020 2019 Sales revenue $3,800 $3,460 Costs and expenses Cost of goods sold 970 890 Selling & administrative expenses 2.400 2.330 Interest expense 10 20 Total costs and expenses 3,380 3.240 Income before income taxes 420 220 Income tax expense 16B 88 Net Income $252 $132 Compute the following ratios for 2020 and 2019. Inventory on December 31, 2018, was $340. Assets on December 31, 2018, were $1.900. Equity on December 31, 2018, was $900. (Round current ratio and inventory turnover to 2 decimal places, e.g. 15.25. Round other answers to 1 decimal place, e.g. 15.2 or 15.2%) 2020 :1 (a) Current ratio times (b) Inventory turnover % (c) Profit margin % (d) Return on assets % le) Return on common stockholders' equity % (f) Debt to assets ratio times Times interest earned Ness Company Income Statements For the Years Ended December 31 (In thousands) 2020 2019 Sales revenue $3,800 $3,460 Costs and expenses Cost of goods sold 970 890 Selling & administrative expenses 2.400 2,330 Interest expense 10 20 Total costs and expenses 3,380 3,240 Income before income taxes 420 220 Income tax expense 168 88 Net income $252 $132 Compute the following ratios for 2020 and 2019. Inventory on December 31, 2018, was $340. Assets on December 31, 2018, were $1.900. Equity on December 31, 2018, was $900. (Round current ratio and inventory turnover to 2 decimal places, e.g. 15.25. Round other answers to 1 decimal place, e.g. 15.2 or 15.2%) 2019 2020 :1 times times lover % % % % its % % imon stockholders' equity % % ratio times times earned