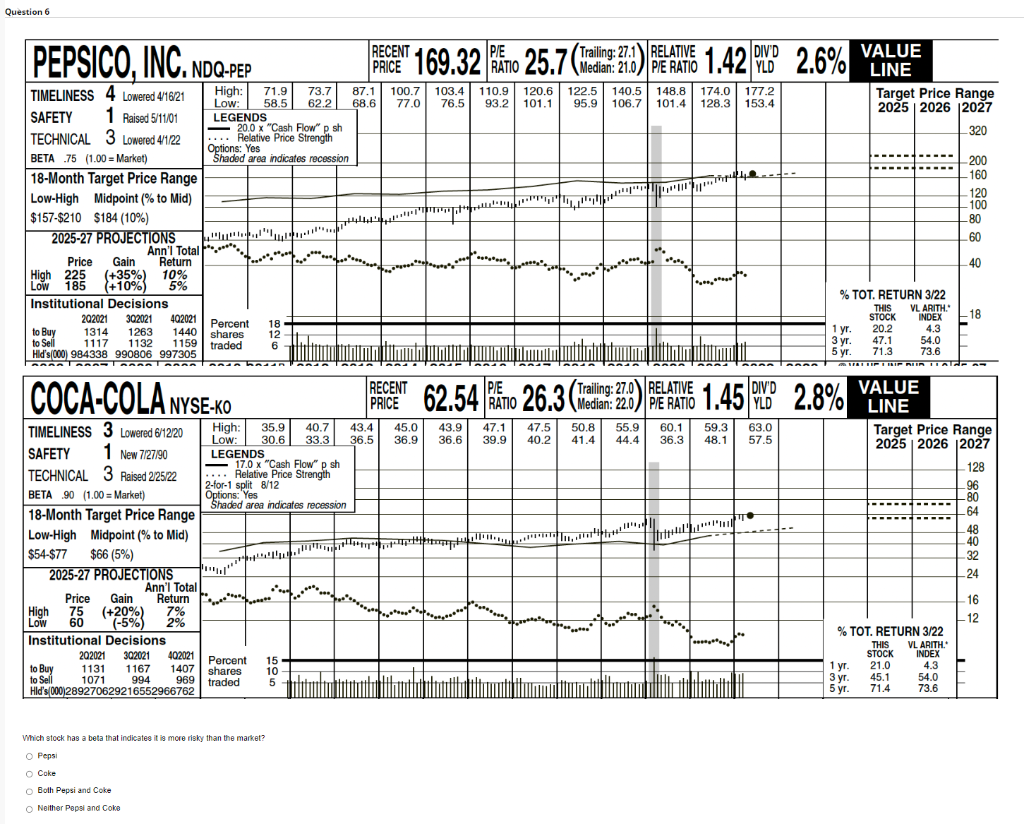
Question 6 PEPSICO, INC. NDO-PEP TIMELINESS 4 Lowered 4/16/21 High: Low: LEGENDS SAFETY 1 Raised 5/11/01 TECHNICAL 3 Lowered 4/1/22 BETA 75 (1.00 = Market) 20.0 x "Cash Flow" p sh .... Relative Price Strength Options: Yes Shaded area indicates recession 18-Month Target Price Range Low-High Midpoint (% to Mid) $157-$210 $184 (10%) 2025-27 PROJECTIONS Ann'l Total Price Gain Return High 225 (+35%) 10% Low 185 (+10%) 5% Institutional Decisions 202021 302021 402021 1440 1314 1263 to Buy to Sell 1117 1132 1159 traded Hid's (000) 984338 990806 997305 COCA-COLA NYSE-KO TIMELINESS 3 Lowered 6/12/20 SAFETY 1 New 7/27/90 TECHNICAL 3 Raised 2/25/22 BETA 90 (1.00= Market) 18-Month Target Price Range Low-High Midpoint (% to Mid) $54-$77 $66 (5%) 2025-27 PROJECTIONS Ann'l Total Price Gain Return High 75 (+20%) 7% (-5%) 2% Low 60 Institutional Decisions 202021 302021 402021 1131 1167 1407 1071 994 Hld's(000)289270629216552966762 to Buy to Sell Percent 18 shares 12 6 High: Low: 71.9 73.7 87.1 100.7 103.4 110.9 120.6 122.5 140.5 58.5 62.2 68.6 77.0 76.5 93.2 101.1 95.9 969 traded Percent 15 shares 10 5 1.***. 1. LEGENDS -17.0 x "Cash Flow" p shi .... Relative Price Strength 2-for-1 split 8/12 Options: Yes Shaded area indicates recession Which stock has a beta that indicates it is more risky than the market? O Pepsi O Coke O Both Pepsi and Coke ONeither Pepsi and Coke And P/E RECENT 169.32 TO 25.7 (Trdian: 27:) ERA 1.42 2.6% Ano RELATIVE 21.0 PIE RATIO YLD 35.9 40.7 43.4 45.0 30.6 33.3 36.5 36.9 ... **** 148.8 174.0 177.2 106.7 101.4 128.3 153.4 wuttatatation PEC 62.54 RATIO 26.3 (Median: 22.0) P/E RATIO 1.45 RECENT P/E RELATIVE 43.9 47.1 47.5 36.6 39.9 40.2 all "||| MALA CO/ VALUE LINE 50.8 55.9 60.1 59.3 63.0 41.4 44.4 36.3 48.1 57.5 % TOT. RETURN 3/22 THIS VL ARITH." STOCK 1 yr. 3 yr. 5 yr. DIV'D YLD 2.8% Target Price Range 2025 2026 2027 320 1 yr. 3 yr. 5 yr. 20.2 47.1 71.3 VALUE LINE INDEX 4.3 % TOT. RETURN 3/22 VL ARITH.' INDEX 4.3 THIS STOCK 54.0 73.6 21.0 45.1 71.4 -200 - 160 Target Price Range 2025 2026 2027 54.0 73.6 120 -100 -80 60 40 -18 -128 96 -80 64 48 40 -32 24 16 -12


