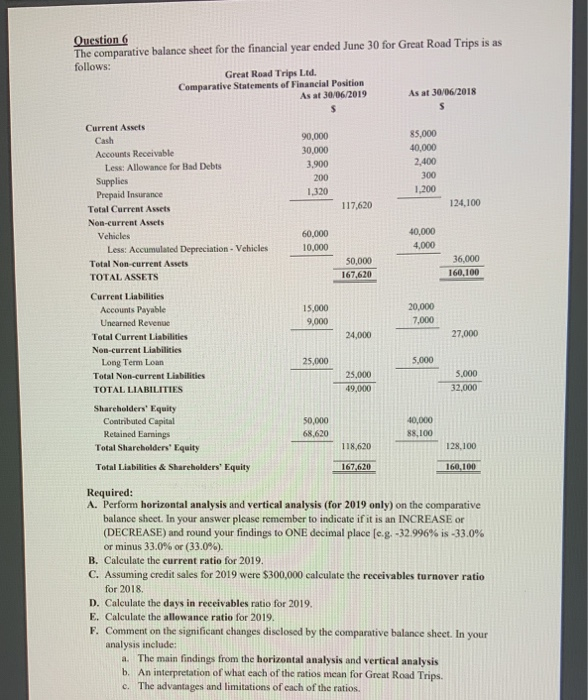
Question 6 The comparative balance sheet for the financial year ended June 30 for Great Road Trips is as follows: Great Road Trips Ltd. Comparative Statements of Financial Position As al 30/06/2019 As at 30/06/2018 90,000 30,000 3.900 200 1.320 85,000 40,000 2,400 300 1,200 Current Assets Cash Accounts Receivable Less: Allowance for Bad Debts Supplies Prepaid Insurance Total Current Assets Non-current Assets Vehicles Less: Accumulated Depreciation - Vehicles Total Non-current Assets TOTAL ASSETS 117,620 124,100 60,000 10,000 40,000 4,000 50,000 167,620 36,000 160,100 Current Liabilities Accounts Payable 15.000 20,000 Unearned Revenue 9,000 7.000 Total Current Liabilities 24,000 27,000 Non-current Liabilities Long Term Loan 25,000 5.000 Total Non-current Liabilities 25,000 5.000 TOTAL LIABILITIES 49,000 32.000 Shareholders' Equity Contributed Capital 50,000 40,000 Retained Earnings 68,620 88,100 Total Shareholders' Equity 118,620 128.100 Total Liabilities & Shareholders' Equity 167,620 160,100 Required: A. Perform horizontal analysis and vertical analysis (for 2019 only) on the comparative balance sheet. In your answer please remember to indicate if it is an INCREASE or (DECREASE) and round your findings to ONE decimal place (c.g. -32.996% is -33.0% or minus 33.0% or (33.0%). B. Calculate the current ratio for 2019. C. Assuming credit sales for 2019 were $300,000 calculate the receivables turnover ratio for 2018 D. Calculate the days in receivables ratio for 2019. E. Calculate the allowance ratio for 2019. F. Comment on the significant changes disclosed by the comparative balance sheet. In your analysis include: a. The main findings from the horizontal analysis and vertical analysis b. An interpretation of what each of the ratios mean for Great Road Trips. c. The advantages and limitations of each of the ratios