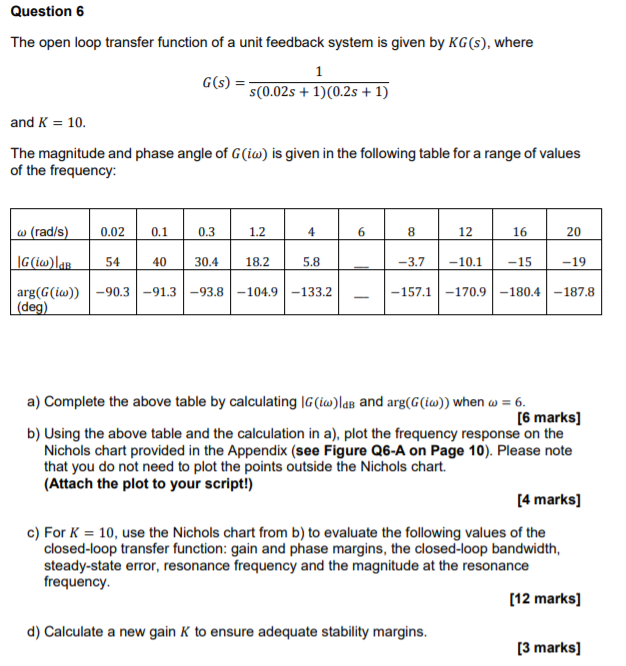
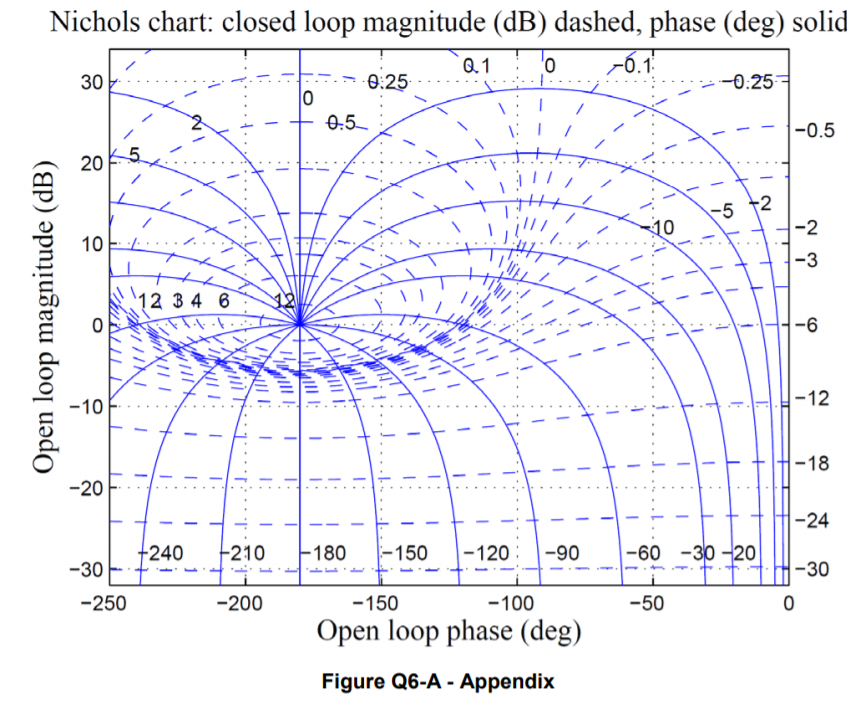
Question 6 The open loop transfer function of a unit feedback system is given by KG(s), where G(s) = s(0.02s + 1)(0.2s +1) and K = 10. The magnitude and phase angle of Gim) is given in the following table for a range of values of the frequency: w (rad/s) 0.02 0.1 0.3 1.2 4 6 8 12 16 20 |G(im) 54 40 30.4 18.2 5.8 -3.7 -10.1 -15 -19 argGiw))-90.3-91.3-93.8-104.9 -133.2 (deg) - 157.1-170.9 -180.4 -187.8 a) Complete the above table by calculating Giw lds and arg((im)) when w = 6. [6 marks] b) Using the above table and the calculation in a), plot the frequency response on the Nichols chart provided in the Appendix (see Figure Q6-A on Page 10). Please note that you do not need to plot the points outside the Nichols chart (Attach the plot to your script!) [4 marks] c) For K = 10, use the Nichols chart from b) to evaluate the following values of the closed-loop transfer function: gain and phase margins, the closed-loop bandwidth, steady-state error, resonance frequency and the magnitude at the resonance frequency [12 marks] d) Calculate a new gain K to ensure adequate stability margins. [3 marks) Nichols chart: closed loop magnitude (dB) dashed, phase (deg) solid 2.1 o -0.1 30 0:25 -0:25 0 0.5 -0.5 5 20 1-5 +2 / 10 10 L -2 - -3 12 B 4 6 Open loop magnitude (dB) 6 -12 -10 -18 1 -20 -24 +240 +210 210 - 18 180 -150 -120 -90 -60-30-20 -30 -30 -250 -200 -50 0 -150 -100 Open loop phase (deg) Figure Q6-A - Appendix Question 6 The open loop transfer function of a unit feedback system is given by KG(s), where G(s) = s(0.02s + 1)(0.2s +1) and K = 10. The magnitude and phase angle of Gim) is given in the following table for a range of values of the frequency: w (rad/s) 0.02 0.1 0.3 1.2 4 6 8 12 16 20 |G(im) 54 40 30.4 18.2 5.8 -3.7 -10.1 -15 -19 argGiw))-90.3-91.3-93.8-104.9 -133.2 (deg) - 157.1-170.9 -180.4 -187.8 a) Complete the above table by calculating Giw lds and arg((im)) when w = 6. [6 marks] b) Using the above table and the calculation in a), plot the frequency response on the Nichols chart provided in the Appendix (see Figure Q6-A on Page 10). Please note that you do not need to plot the points outside the Nichols chart (Attach the plot to your script!) [4 marks] c) For K = 10, use the Nichols chart from b) to evaluate the following values of the closed-loop transfer function: gain and phase margins, the closed-loop bandwidth, steady-state error, resonance frequency and the magnitude at the resonance frequency [12 marks] d) Calculate a new gain K to ensure adequate stability margins. [3 marks) Nichols chart: closed loop magnitude (dB) dashed, phase (deg) solid 2.1 o -0.1 30 0:25 -0:25 0 0.5 -0.5 5 20 1-5 +2 / 10 10 L -2 - -3 12 B 4 6 Open loop magnitude (dB) 6 -12 -10 -18 1 -20 -24 +240 +210 210 - 18 180 -150 -120 -90 -60-30-20 -30 -30 -250 -200 -50 0 -150 -100 Open loop phase (deg) Figure Q6-A - Appendix