Question 6
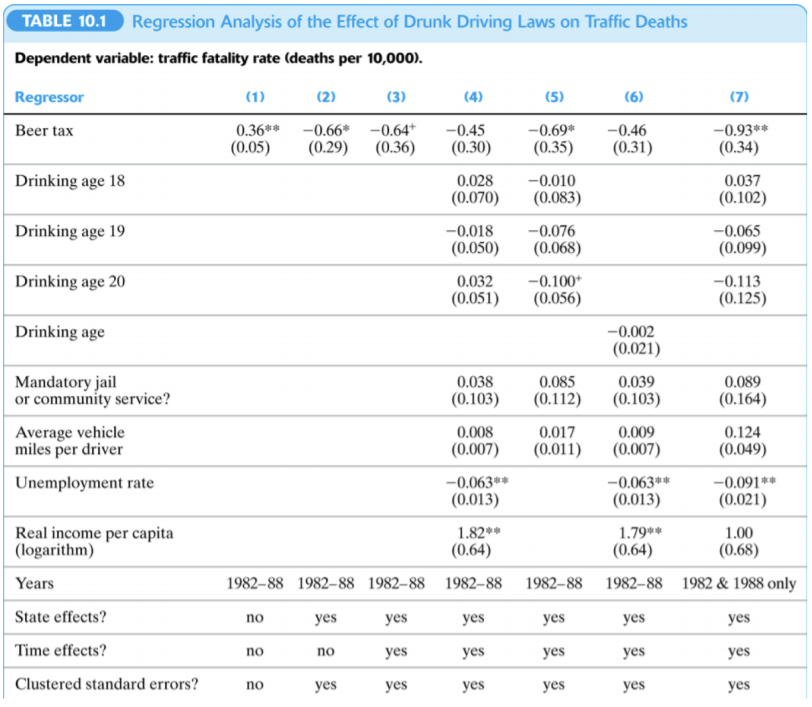
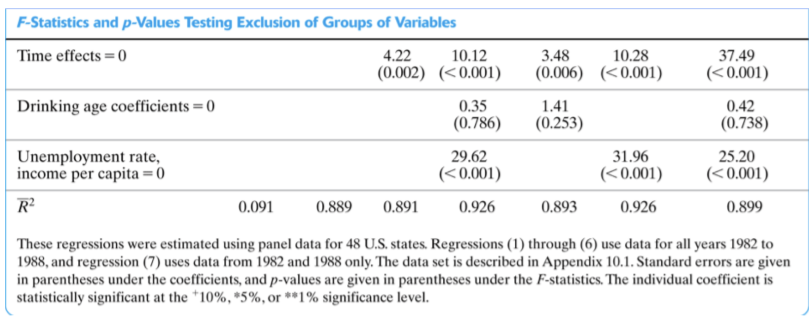
This exercise refers to the drunk driving panel data regression, summarised in Table 10.1 on pages 31 and 31 of the Lecture 8 slides. Arizona has a population of 7.28 million people. The drinking age in Arizona is 21. Suppose that Arizona lowered its drinking age to 19. Using the results in the table, you consider predicting the change in the number of traffic fatalities in the next year. Choose the correct statement: 3. The number of fatalities would increase by 0.028 deaths per 10,000 and this prediction is not statistically significant at the 5% level according to column (4). D. The number of fatalities would decrease by 0.010 deaths per 10,000 and this prediction is not statistically significant at the 5% level according to column (5). C. The number of fatalities would decrease by 0.004 deaths per 10,000 and this prediction is not statistically significant at the 5% level according to column (6). O d. The number of fatalities would increase by 0.037 deaths per 10,000 and this prediction is not statistically significant at the 5% level according to column (7). e. Columns (4) to (7) all predict that the number of fatalities would substantially decrease and the predictions are all statistically significant at the 5% level.TABLE 10.1 Regression Analysis of the Effect of Drunk Driving Laws on Traffic Deaths Dependent variable: traffic fatality rate (deaths per 10,000). Regressor (1) (2) (3) (4) (5) (6) (7) Beer tax 0.36** -0.66* -0.64+ -0.45 -0.69* -0.46 -0.93** (0.05) (0.29) (0.36) (0.30) (0.35) (0.31) (0.34) Drinking age 18 0.028 -0.010 0.037 (0.070) (0.083) (0.102) Drinking age 19 -0.018 -0.076 -0.065 (0.050) (0.068) (0.099) Drinking age 20 0.032 -0.100+ -0.113 (0.051) (0.056) (0.125) Drinking age -0.002 (0.021) Mandatory jail 0.038 0.085 0.039 0.089 or community service? (0.103) (0.112) (0.103) (0.164) Average vehicle 0.008 0.017 0.009 0.124 miles per driver (0.007) (0.011) (0.007) (0.049) Unemployment rate -0.063** -0.063** -0.091** (0.013) (0.013) (0.021) Real income per capita 1.82** 1.79 1.00 (logarithm) (0.64) (0.64) (0.68) Years 1982-88 1982-88 1982-88 1982-88 1982-88 1982-88 1982 & 1988 only State effects? no yes yes yes yes yes yes Time effects? no no yes yes yes yes yes Clustered standard errors? no yes yes yes yes yes yesF-Statistics and p-Values Testing Exclusion of Groups of Variables Time effects = 0 4.22 10.12 3.48 10.28 37.49 (0.002) (


