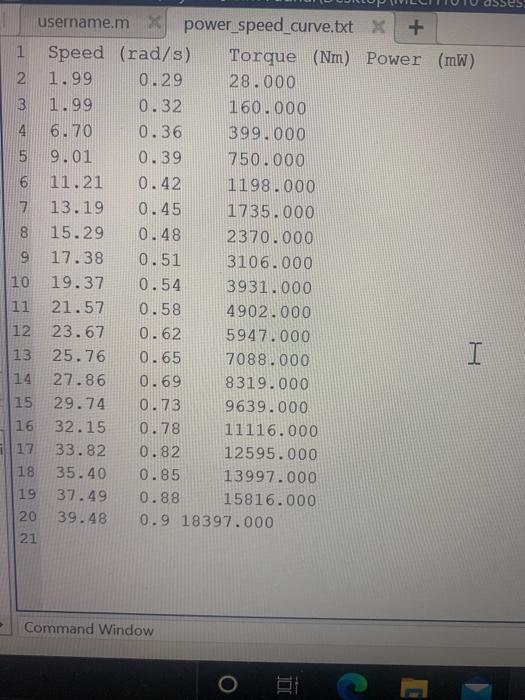
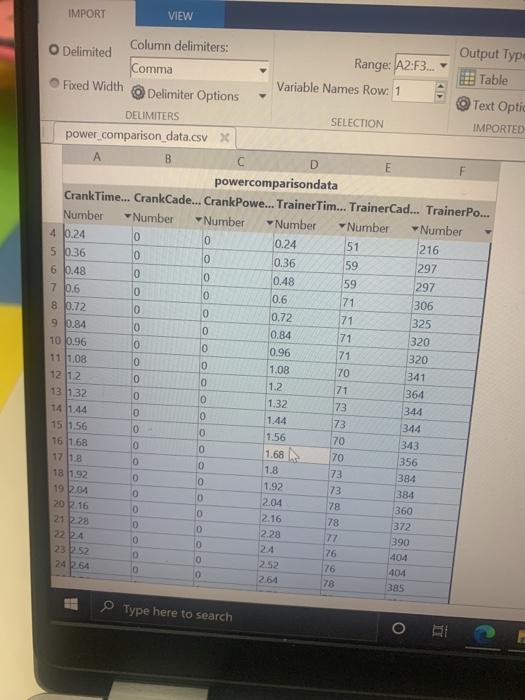
Question 6.6 - plot the power generated against speed rpm. On the same % axes plot the line of best fit determined in 6.2 by any means % (only plot up to around 380rpm). Finally put a red circle on the plot $ showing the point at which the power is 5000mW. % Label the figure appropriately. [6 marks] T B username.m X power_speed_curve.txt X + 1 Speed (rad/s) Torque (Nm) Power (mW) 2 1.99 0.29 28.000 3 1.99 0.32 160.000 4 6.70 0.36 399.000 5 9.01 0.39 750.000 6 11.21 0.42 1198.000 7 13.19 0.45 1735.000 8 15.29 0.48 2370.000 9 17.38 0.51 3106.000 10 19.37 0.54 3931.000 21.57 0.58 4902.000 23.67 0.62 5947.000 25.76 0.65 7088.000 I 14 27.86 0.69 8319.000 29.74 0.73 9639.000 16 32.15 0.78 11116.000 17 33.82 0.82 12595.000 18 35.40 0.85 13997.000 19 37.49 0.88 15816.000 39.48 0.9 18397.000 21 11 1 1 12 13 1 1 15 20 Command Window IMPORT VIEW 216 71 Column delimiters: O Delimited Output Type Range: A2:F3... Comma Table Fixed Width Variable Names Row: 1 Delimiter Options Text Optic DELIMITERS SELECTION IMPORTED power comparison data.csvx B E powercomparisondata CrankTime... CrankCade... CrankPowe... Trainer Tim... Trainer Cad... TrainerPo... Number Number Number Number Number Number 4 0.24 10 0 0.24 51 5 0.36 0 0 0.36 59 297 6 0.48 0 0 0.48 59 297 7 10,6 0 0 0.6 306 8 0.72 0 0 0.72 71 325 9 0.84 0 0 0.84 71 320 10 10.96 0 0 0.96 71 320 11 1.08 0 0 1.08 70 341 0 0 1.2 71 364 13 1.32 0 0 1.32 73 344 141.44 0 0 73 344 10 O 1.56 70 343 16 1.68 0 0 1.68 70 356 0 0 1.8 18 1.92 73 384 0 0 1.92 73 19 2.84 384 0 0 2.04 2016 78 360 0 0 2.16 2128 78 0 872 D 2264 2.28 77 390 0 0 23 52 76 O 404 0 24 64 252 76 404 0 0 2.64 78 1212 15 1.56 17 1.8 385 Type here to search RI Question 6.6 - plot the power generated against speed rpm. On the same % axes plot the line of best fit determined in 6.2 by any means % (only plot up to around 380rpm). Finally put a red circle on the plot $ showing the point at which the power is 5000mW. % Label the figure appropriately. [6 marks] T B username.m X power_speed_curve.txt X + 1 Speed (rad/s) Torque (Nm) Power (mW) 2 1.99 0.29 28.000 3 1.99 0.32 160.000 4 6.70 0.36 399.000 5 9.01 0.39 750.000 6 11.21 0.42 1198.000 7 13.19 0.45 1735.000 8 15.29 0.48 2370.000 9 17.38 0.51 3106.000 10 19.37 0.54 3931.000 21.57 0.58 4902.000 23.67 0.62 5947.000 25.76 0.65 7088.000 I 14 27.86 0.69 8319.000 29.74 0.73 9639.000 16 32.15 0.78 11116.000 17 33.82 0.82 12595.000 18 35.40 0.85 13997.000 19 37.49 0.88 15816.000 39.48 0.9 18397.000 21 11 1 1 12 13 1 1 15 20 Command Window IMPORT VIEW 216 71 Column delimiters: O Delimited Output Type Range: A2:F3... Comma Table Fixed Width Variable Names Row: 1 Delimiter Options Text Optic DELIMITERS SELECTION IMPORTED power comparison data.csvx B E powercomparisondata CrankTime... CrankCade... CrankPowe... Trainer Tim... Trainer Cad... TrainerPo... Number Number Number Number Number Number 4 0.24 10 0 0.24 51 5 0.36 0 0 0.36 59 297 6 0.48 0 0 0.48 59 297 7 10,6 0 0 0.6 306 8 0.72 0 0 0.72 71 325 9 0.84 0 0 0.84 71 320 10 10.96 0 0 0.96 71 320 11 1.08 0 0 1.08 70 341 0 0 1.2 71 364 13 1.32 0 0 1.32 73 344 141.44 0 0 73 344 10 O 1.56 70 343 16 1.68 0 0 1.68 70 356 0 0 1.8 18 1.92 73 384 0 0 1.92 73 19 2.84 384 0 0 2.04 2016 78 360 0 0 2.16 2128 78 0 872 D 2264 2.28 77 390 0 0 23 52 76 O 404 0 24 64 252 76 404 0 0 2.64 78 1212 15 1.56 17 1.8 385 Type here to search RI