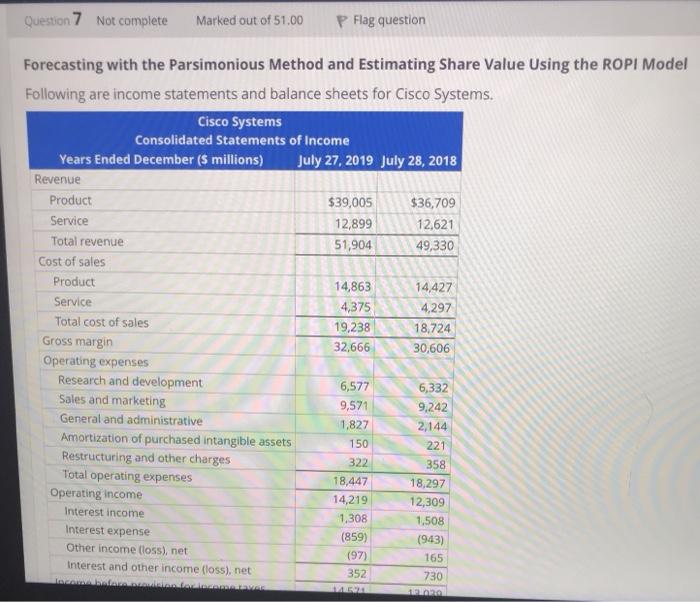
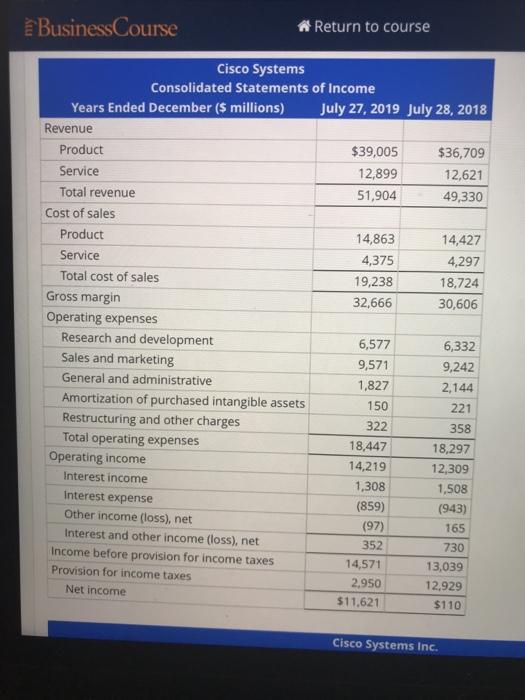
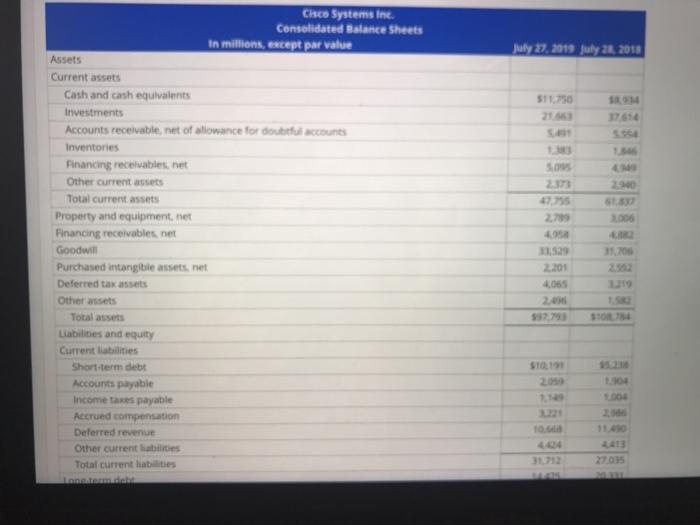
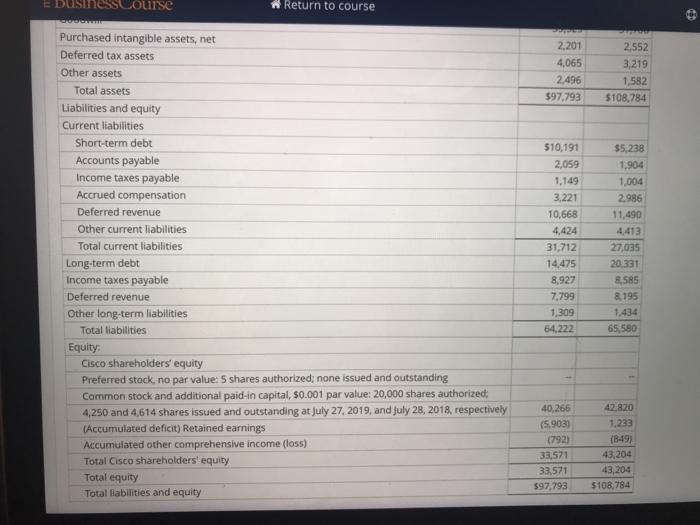
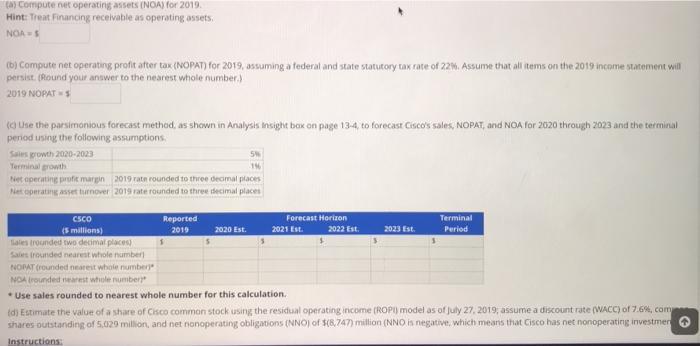
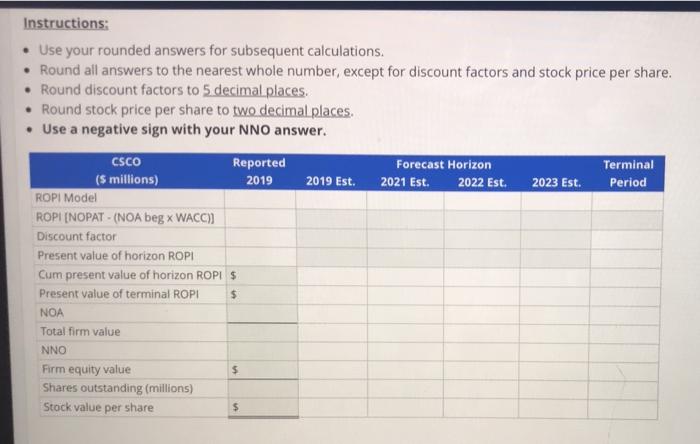
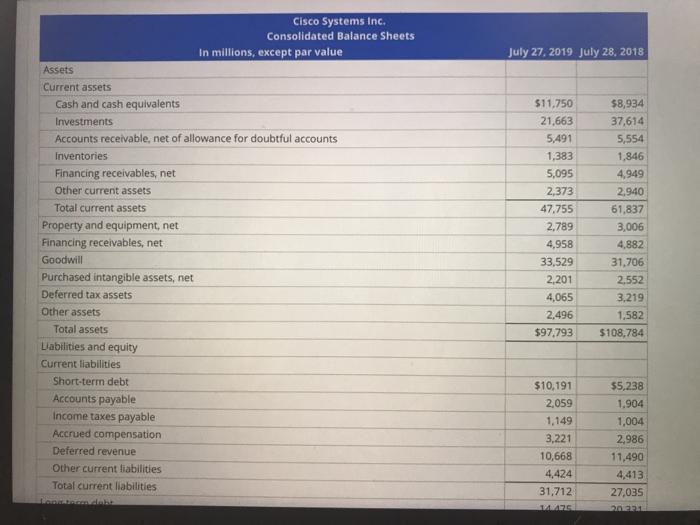
Question 7 Not complete Marked out of 51.00 P Flag question Forecasting with the Parsimonious Method and Estimating Share Value Using the ROPI Model Following are income statements and balance sheets for Cisco Systems. Cisco Systems Consolidated Statements of Income Years Ended December (5 millions) July 27, 2019 July 28, 2018 Revenue Product $39,005 $36,709 Service 12,899 12,621 Total revenue 51,904 49,330 Cost of sales Product 14,863 14,427 Service 4,375 4,297 Total cost of sales 19,238 18,724 Gross margin 32,666 30,606 Operating expenses Research and development 6,577 6,332 Sales and marketing 9,571 9,242 General and administrative 1,827 2,144 Amortization of purchased intangible assets 150 221 Restructuring and other charges 322 358 Total operating expenses 18,447 18,297 Operating income 14,219 12,309 Interest income 1,308 1,508 Interest expense (859) (943) Other income (loss), net (97) 165 Interest and other income (loss), net 352 730 com.co ALORA Business Course Return to course Cisco Systems Consolidated Statements of income Years Ended December ($ millions) July 27, 2019 July 28, 2018 Revenue Product $39,005 $36,709 Service 12,899 12,621 Total revenue 51,904 49,330 Cost of sales Product 14,863 14,427 Service 4,375 4,297 Total cost of sales 19,238 18,724 Gross margin 32,666 30,606 Operating expenses Research and development 6,577 6,332 Sales and marketing 9,571 9,242 General and administrative 1,827 2,144 Amortization of purchased intangible assets 150 221 Restructuring and other charges 322 358 Total operating expenses 18,447 18,297 Operating income 14,219 12,309 Interest income 1,308 1,508 Interest expense (859) (943) Other income (loss), net (97) 165 Interest and other income (loss), net 352 730 Income before provision for income taxes 14,571 13,039 Provision for income taxes 2,950 12,929 Net income $11,621 $110 Cisco Systems Inc. July 27, 2019 July 21, 2018 511.750 21663 17.614 5.09 M 200 2006 27 4a Chico Systems Inc. Consolidated Balance Sheets in millions, except par value Assets Current assets Cash and cash equivalents Investments Accounts receivable, net of allowance for doubtful accounts Inventories Financing receivables.net Other current assets Total current assets Property and equipment.net Financing receivables net Goodwill Purchased intangible assets.net Deferred tax assets Other assets Total assets Liabilities and equity Current abilities Short-term debt Accounts payable Income taxes payable Accrued compensation Deferred revenue Other current liabilities Total current liabilities tomid 11.0 2301 4065 S10.11 1.1 E businesscourse Return to course 2,201 4,065 2496 $97.793 2.552 3,219 1,582 $108,784 Purchased intangible assets, net Deferred tax assets Other assets Total assets Liabilities and equity Current liabilities Short-term debt Accounts payable Income taxes payable Accrued compensation Deferred revenue Other current liabilities Total current liabilities Long-term debt Income taxes payable Deferred revenue Other long-term liabilities Total liabilities Equity: Cisco shareholders' equity Preferred stock, no par value: 5 shares authorized: none issued and outstanding Common stock and additional paid-in capital, $0.001 par value: 20,000 shares authorized 4,250 and 4,614 shares issued and outstanding at July 27,2019, and July 28, 2018, respectively (Accumulated deficit) Retained earnings Accumulated other comprehensive income (loss) Total Cisco shareholders equity Total equity Total labilities and equity 510,191 2,059 1,149 3.221 10,668 4.424 31,712 14,475 8,927 7.799 1.309 64,222 $5,238 1.904 1,004 2.986 11,490 4,413 27,035 20.331 8,585 8.195 65 580 40.266 (5.9031 42,820 1,233 (849) 43,204 43,204 $108,784 33,571 33,571 $97,793 Cal Compute net operating assets (NOA) for 2019 Hint: Treat Financing receivable as operating assets. NOA (6) Compute net operating profit after tax (NOPAT) for 2019, assuming a federal and state statutory tax rate of 223. Assume that all items on the 2019 income statement will persist. (Round your answer to the nearest whole number 2019 NOPAT (ose the parsimonious forecast method, as shown in Analysis insight box on page 13-4, to forecast Cisco's sales, NOPAT, and NOA for 2020 through 2023 and the terminal period using the following assumptions Sales growth 2020-2023 59 190 Net operating profit margin 2019 rata rounded to three decimal places Net operating se turnover 2019 rate rounded to three decimal places CSCO Reported Forecast Horizon Terminal (5 millions) 2019 2020 Est. 2021 Est. 2022 Est, 2023 Est. Period Malestrounded two decimal places Sabes rounded nearest Whole number NORAT (rounded nearest whole number NOA rounded nearest whole number * Use sales rounded to nearest whole number for this calculation (d) Estimate the value of a share of Cisco common stock using the residual operating income (ROP model as of July 27, 2019, assume a discount rate (WACC) of 7.6%, com shares outstanding of 5,029 million, and net nonoperating obligations (NNO) of (8.747) million (NNO is negative, which means that Cisco has net nonoperating investmer Instructions: Instructions: Use your rounded answers for subsequent calculations. Round all answers to the nearest whole number, except for discount factors and stock price per share. Round discount factors to 5 decimal places. Round stock price per share to two decimal places Use a negative sign with your NNO answer. CSCO Reported Forecast Horizon Terminal (5 millions) 2019 2019 Est. 2021 Est. 2022 Est. 2023 Est. Period ROPI Model ROPI[NOPAT - (NOA beg x WACC) Discount factor Present value of horizon ROPI Cum present value of horizon ROPI $ Present value of terminal ROPI $ NOA Total firm value NNO Firm equity value $ Shares outstanding (millions) Stock value per share $ July 27, 2019 July 28, 2018 Cisco Systems Inc. Consolidated Balance Sheets In millions, except par value Assets Current assets Cash and cash equivalents Investments Accounts receivable, net of allowance for doubtful accounts Inventories Financing receivables, net Other current assets Total current assets Property and equipment, net Financing receivables, net Goodwill Purchased intangible assets, net Deferred tax assets Other assets Total assets Liabilities and equity Current liabilities Short-term debt Accounts payable Income taxes payable Accrued compensation Deferred revenue Other current liabilities Total current liabilities $11.750 21.663 5,491 1,383 5,095 2,373 47.755 2.789 4,958 33,529 2,201 4,065 2,496 $97,793 $8,934 37,614 5,554 1,846 4,949 2.940 61,837 3,006 4,882 31,706 2,552 3.219 1.582 $108,784 $10,191 2,059 1,149 3,221 10,668 4,424 31,712 WS $5,238 1.904 1,004 2,986 11,490 4,413 27,035 Question 7 Not complete Marked out of 51.00 P Flag question Forecasting with the Parsimonious Method and Estimating Share Value Using the ROPI Model Following are income statements and balance sheets for Cisco Systems. Cisco Systems Consolidated Statements of Income Years Ended December (5 millions) July 27, 2019 July 28, 2018 Revenue Product $39,005 $36,709 Service 12,899 12,621 Total revenue 51,904 49,330 Cost of sales Product 14,863 14,427 Service 4,375 4,297 Total cost of sales 19,238 18,724 Gross margin 32,666 30,606 Operating expenses Research and development 6,577 6,332 Sales and marketing 9,571 9,242 General and administrative 1,827 2,144 Amortization of purchased intangible assets 150 221 Restructuring and other charges 322 358 Total operating expenses 18,447 18,297 Operating income 14,219 12,309 Interest income 1,308 1,508 Interest expense (859) (943) Other income (loss), net (97) 165 Interest and other income (loss), net 352 730 com.co ALORA Business Course Return to course Cisco Systems Consolidated Statements of income Years Ended December ($ millions) July 27, 2019 July 28, 2018 Revenue Product $39,005 $36,709 Service 12,899 12,621 Total revenue 51,904 49,330 Cost of sales Product 14,863 14,427 Service 4,375 4,297 Total cost of sales 19,238 18,724 Gross margin 32,666 30,606 Operating expenses Research and development 6,577 6,332 Sales and marketing 9,571 9,242 General and administrative 1,827 2,144 Amortization of purchased intangible assets 150 221 Restructuring and other charges 322 358 Total operating expenses 18,447 18,297 Operating income 14,219 12,309 Interest income 1,308 1,508 Interest expense (859) (943) Other income (loss), net (97) 165 Interest and other income (loss), net 352 730 Income before provision for income taxes 14,571 13,039 Provision for income taxes 2,950 12,929 Net income $11,621 $110 Cisco Systems Inc. July 27, 2019 July 21, 2018 511.750 21663 17.614 5.09 M 200 2006 27 4a Chico Systems Inc. Consolidated Balance Sheets in millions, except par value Assets Current assets Cash and cash equivalents Investments Accounts receivable, net of allowance for doubtful accounts Inventories Financing receivables.net Other current assets Total current assets Property and equipment.net Financing receivables net Goodwill Purchased intangible assets.net Deferred tax assets Other assets Total assets Liabilities and equity Current abilities Short-term debt Accounts payable Income taxes payable Accrued compensation Deferred revenue Other current liabilities Total current liabilities tomid 11.0 2301 4065 S10.11 1.1 E businesscourse Return to course 2,201 4,065 2496 $97.793 2.552 3,219 1,582 $108,784 Purchased intangible assets, net Deferred tax assets Other assets Total assets Liabilities and equity Current liabilities Short-term debt Accounts payable Income taxes payable Accrued compensation Deferred revenue Other current liabilities Total current liabilities Long-term debt Income taxes payable Deferred revenue Other long-term liabilities Total liabilities Equity: Cisco shareholders' equity Preferred stock, no par value: 5 shares authorized: none issued and outstanding Common stock and additional paid-in capital, $0.001 par value: 20,000 shares authorized 4,250 and 4,614 shares issued and outstanding at July 27,2019, and July 28, 2018, respectively (Accumulated deficit) Retained earnings Accumulated other comprehensive income (loss) Total Cisco shareholders equity Total equity Total labilities and equity 510,191 2,059 1,149 3.221 10,668 4.424 31,712 14,475 8,927 7.799 1.309 64,222 $5,238 1.904 1,004 2.986 11,490 4,413 27,035 20.331 8,585 8.195 65 580 40.266 (5.9031 42,820 1,233 (849) 43,204 43,204 $108,784 33,571 33,571 $97,793 Cal Compute net operating assets (NOA) for 2019 Hint: Treat Financing receivable as operating assets. NOA (6) Compute net operating profit after tax (NOPAT) for 2019, assuming a federal and state statutory tax rate of 223. Assume that all items on the 2019 income statement will persist. (Round your answer to the nearest whole number 2019 NOPAT (ose the parsimonious forecast method, as shown in Analysis insight box on page 13-4, to forecast Cisco's sales, NOPAT, and NOA for 2020 through 2023 and the terminal period using the following assumptions Sales growth 2020-2023 59 190 Net operating profit margin 2019 rata rounded to three decimal places Net operating se turnover 2019 rate rounded to three decimal places CSCO Reported Forecast Horizon Terminal (5 millions) 2019 2020 Est. 2021 Est. 2022 Est, 2023 Est. Period Malestrounded two decimal places Sabes rounded nearest Whole number NORAT (rounded nearest whole number NOA rounded nearest whole number * Use sales rounded to nearest whole number for this calculation (d) Estimate the value of a share of Cisco common stock using the residual operating income (ROP model as of July 27, 2019, assume a discount rate (WACC) of 7.6%, com shares outstanding of 5,029 million, and net nonoperating obligations (NNO) of (8.747) million (NNO is negative, which means that Cisco has net nonoperating investmer Instructions: Instructions: Use your rounded answers for subsequent calculations. Round all answers to the nearest whole number, except for discount factors and stock price per share. Round discount factors to 5 decimal places. Round stock price per share to two decimal places Use a negative sign with your NNO answer. CSCO Reported Forecast Horizon Terminal (5 millions) 2019 2019 Est. 2021 Est. 2022 Est. 2023 Est. Period ROPI Model ROPI[NOPAT - (NOA beg x WACC) Discount factor Present value of horizon ROPI Cum present value of horizon ROPI $ Present value of terminal ROPI $ NOA Total firm value NNO Firm equity value $ Shares outstanding (millions) Stock value per share $ July 27, 2019 July 28, 2018 Cisco Systems Inc. Consolidated Balance Sheets In millions, except par value Assets Current assets Cash and cash equivalents Investments Accounts receivable, net of allowance for doubtful accounts Inventories Financing receivables, net Other current assets Total current assets Property and equipment, net Financing receivables, net Goodwill Purchased intangible assets, net Deferred tax assets Other assets Total assets Liabilities and equity Current liabilities Short-term debt Accounts payable Income taxes payable Accrued compensation Deferred revenue Other current liabilities Total current liabilities $11.750 21.663 5,491 1,383 5,095 2,373 47.755 2.789 4,958 33,529 2,201 4,065 2,496 $97,793 $8,934 37,614 5,554 1,846 4,949 2.940 61,837 3,006 4,882 31,706 2,552 3.219 1.582 $108,784 $10,191 2,059 1,149 3,221 10,668 4,424 31,712 WS $5,238 1.904 1,004 2,986 11,490 4,413 27,035