

Answered step by step
Verified Expert Solution
Question
1 Approved Answer
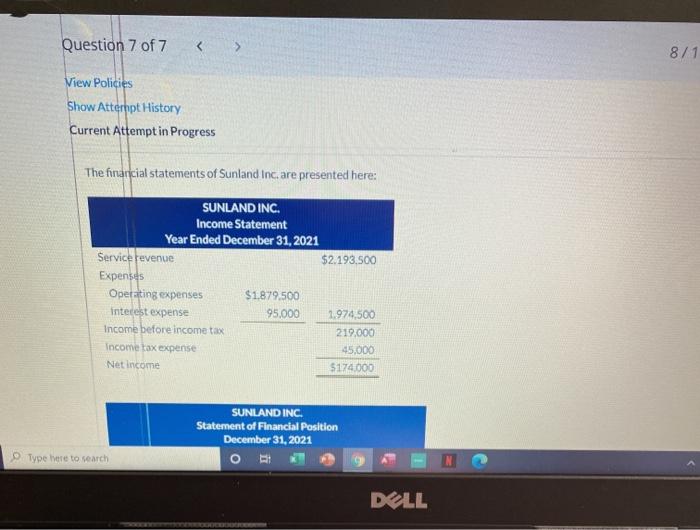
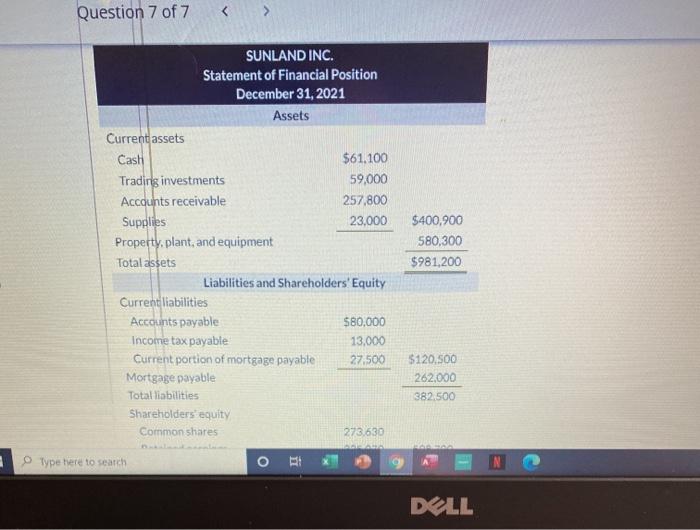
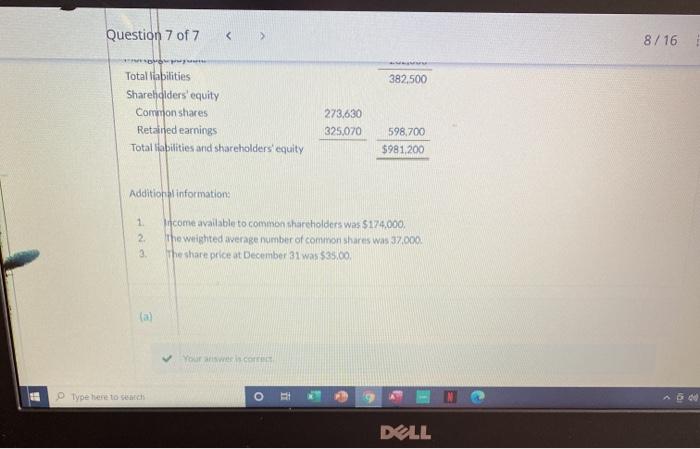
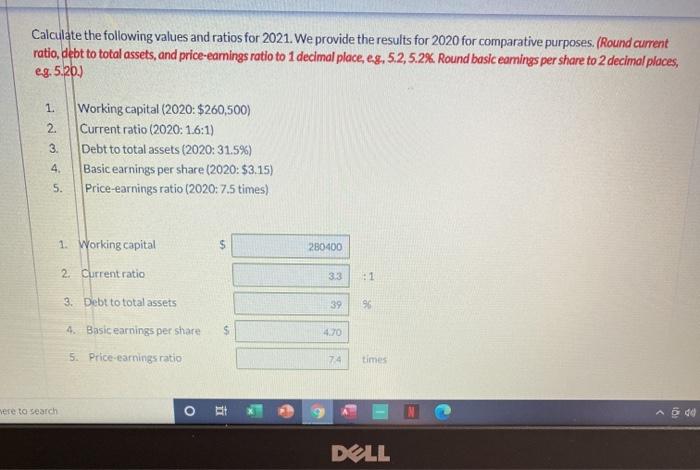
Question 7 of 7 8/1 View Policies Show Attempt History Current Attempt in Progress The financial statements of Sunland Inc. are presented here: SUNLAND INC.
Step by Step Solution
There are 3 Steps involved in it
Step: 1

Get Instant Access to Expert-Tailored Solutions
See step-by-step solutions with expert insights and AI powered tools for academic success
Step: 2

Step: 3
Ace Your Homework with AI
Get the answers you need in no time with our AI-driven, step-by-step assistance
Get Started
Making Accountability Work Dilemmas For Evaluation And For Audit
Authors: Marie-Louise Bemelmans-Videc, Jeremy Lonsdale, Burt Perrin
1st Edition
1412865557, 978-1412865555