

Answered step by step
Verified Expert Solution
Question
1 Approved Answer
.Question 9 Question 9 You generate a scatter plot using Excel. You then have Excel plot the trend line and report the equation and ther

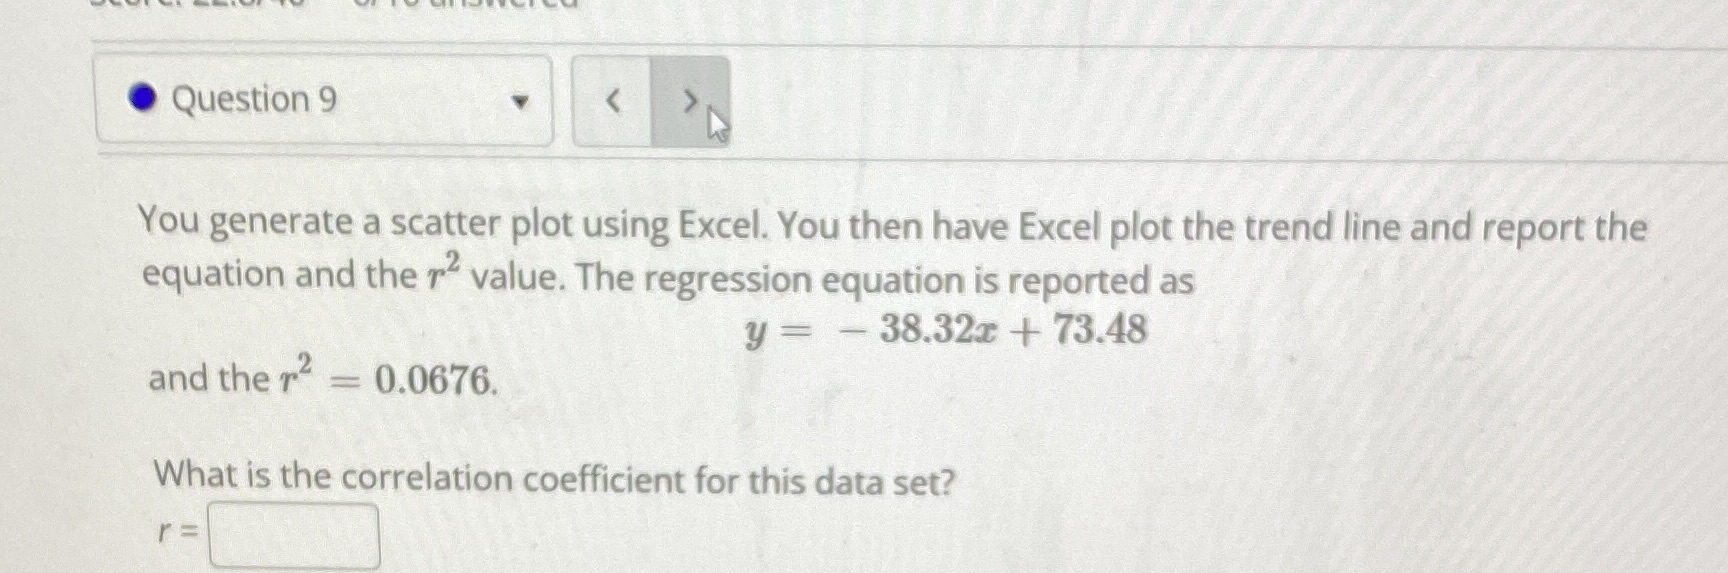
Question 9 You generate a scatter plot using Excel. You then have Excel plot the trend line and report the equation and ther value. The regression equation is reported as - 38.32x + 73.48 2 and the r 0.0676. What is the correlation coefficient for this data set?
Step by Step Solution
There are 3 Steps involved in it
Step: 1

Get Instant Access to Expert-Tailored Solutions
See step-by-step solutions with expert insights and AI powered tools for academic success
Step: 2

Step: 3
Ace Your Homework with AI
Get the answers you need in no time with our AI-driven, step-by-step assistance
Get Started
Bent Functions Results And Applications To Cryptography
Authors: Natalia Tokareva
1st Edition
0128025557, 9780128025550