

Answered step by step
Verified Expert Solution
Question
1 Approved Answer
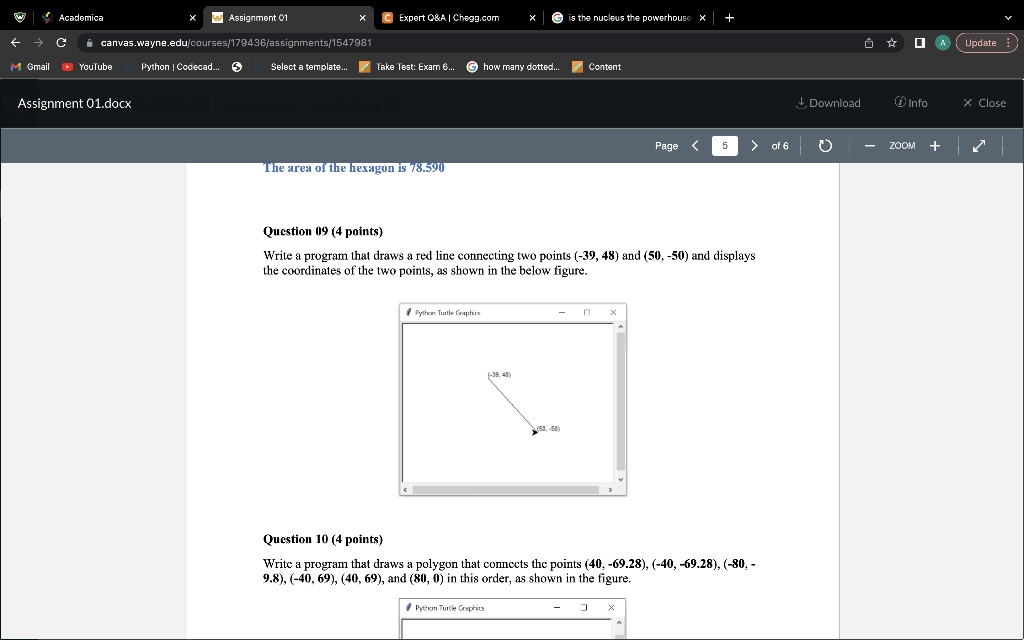
QUESTION 9 import matplotlib.pyplot as plt import numpy as np x1=-39 y1=48 x2=50 y2=-50 x_values=[x1,x2] y_values=[y1,y2] plt.plot(x_values,y_values) plt.show() how do i get matplotlib.pyplot and numpy
 QUESTION 9
import matplotlib.pyplot as plt import numpy as np x1=-39 y1=48 x2=50 y2=-50 x_values=[x1,x2] y_values=[y1,y2] plt.plot(x_values,y_values) plt.show()
how do i get matplotlib.pyplot and numpy
Question (19 (4 points) Write a program that draws a red line connecting two points (39,48) and (50,50) and displays the coordinates of the two points, as shown in the below figure. Question 10 (4 points) Write a program that draws a polygon that connects the points (40,69.28),(40,69.28),(80, 9.8),(40,69),(40,69), and (80,0) in this order, as shown in the figureStep by Step Solution
There are 3 Steps involved in it
Step: 1

Get Instant Access to Expert-Tailored Solutions
See step-by-step solutions with expert insights and AI powered tools for academic success
Step: 2

Step: 3
Ace Your Homework with AI
Get the answers you need in no time with our AI-driven, step-by-step assistance
Get Started
Directions In Databases 12th British National Conference On Databases Bncod 12 Guildford United Kingdom July 6 8 1994 Proceedings Lncs 826
Authors: David S. Bowers
1994th Edition
3540582355, 978-3540582359