

Answered step by step
Verified Expert Solution
Question
1 Approved Answer
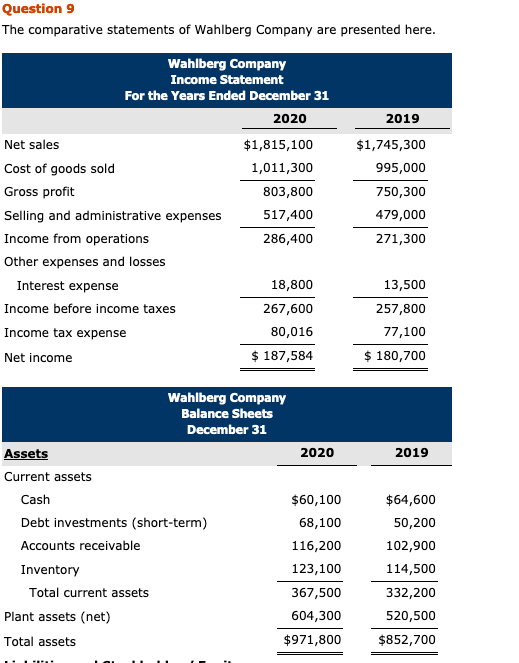
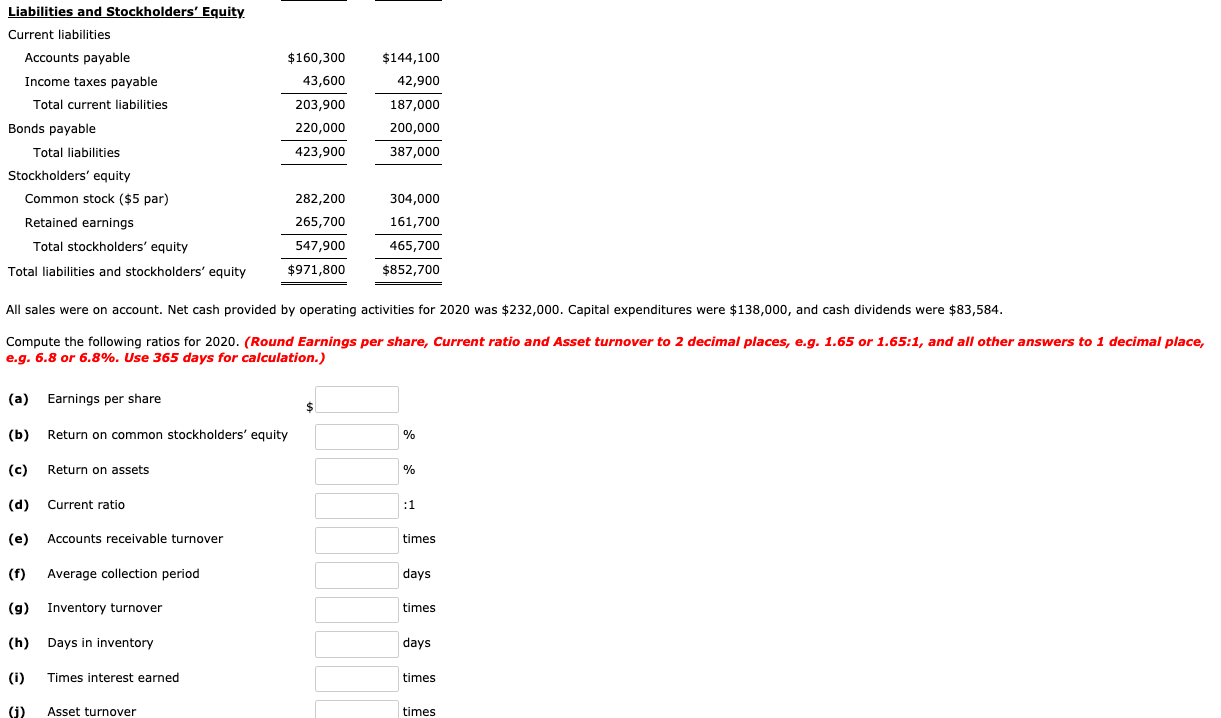
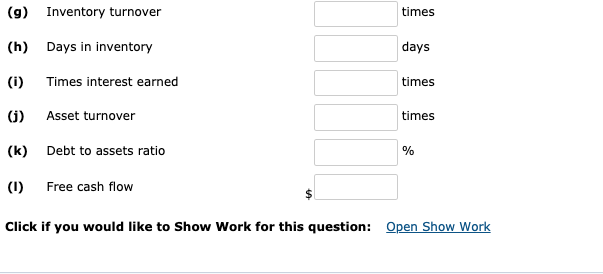
Question 9 The comparative statements of Wahlberg Company are presented here. 2019 Wahlberg Company Income Statement For the Years Ended December 31 2020 Net sales
Step by Step Solution
There are 3 Steps involved in it
Step: 1

Get Instant Access to Expert-Tailored Solutions
See step-by-step solutions with expert insights and AI powered tools for academic success
Step: 2

Step: 3
Ace Your Homework with AI
Get the answers you need in no time with our AI-driven, step-by-step assistance
Get Started
Intermediate Accounting
Authors: kieso, weygandt and warfield.
14th Edition
9780470587232, 470587288, 470587237, 978-0470587287