Question
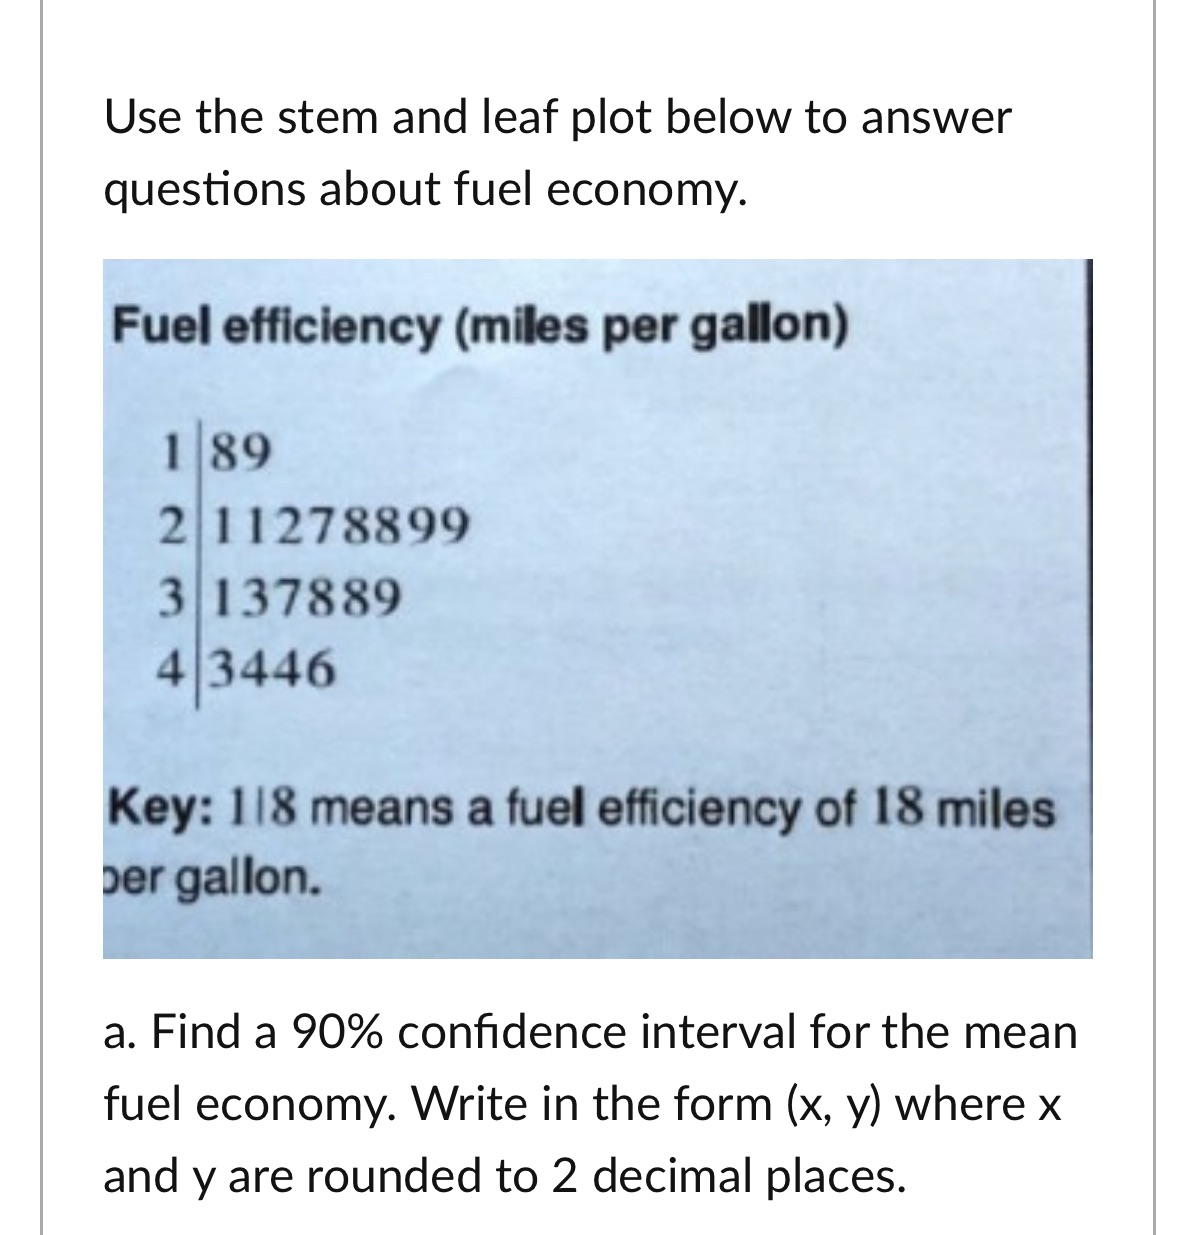
Question A is included in the photo with the data. In addition to question A help me solve question b as well.b. Which of the
Question A is included in the photo with the data. In addition to question A help me solve question b as well.b. Which of the following statements is the correct interpretation of the confidence interval?Group of answer choices90% confidence means that 90% of the time that we take a random sample of 20 cars that the true population mean will be contained in the interval.90% confidence means that 90% of sample means, with sample size n=20, will be in this interval.90% confidence means that 90% is the best estimate of the proportion of cars in the whole population have a fuel economy in this interval.90% confidence means that 90% of cars in your sample have a fuel economy in this interval.90% confidence means that 90% of the time that we take a random sample of 20 cars that our sample mean will be contained in the interval.

Step by Step Solution
There are 3 Steps involved in it
Step: 1

Get Instant Access to Expert-Tailored Solutions
See step-by-step solutions with expert insights and AI powered tools for academic success
Step: 2

Step: 3

Ace Your Homework with AI
Get the answers you need in no time with our AI-driven, step-by-step assistance
Get Started


