Answered step by step
Verified Expert Solution
Link Copied!

Question

1 Approved Answer

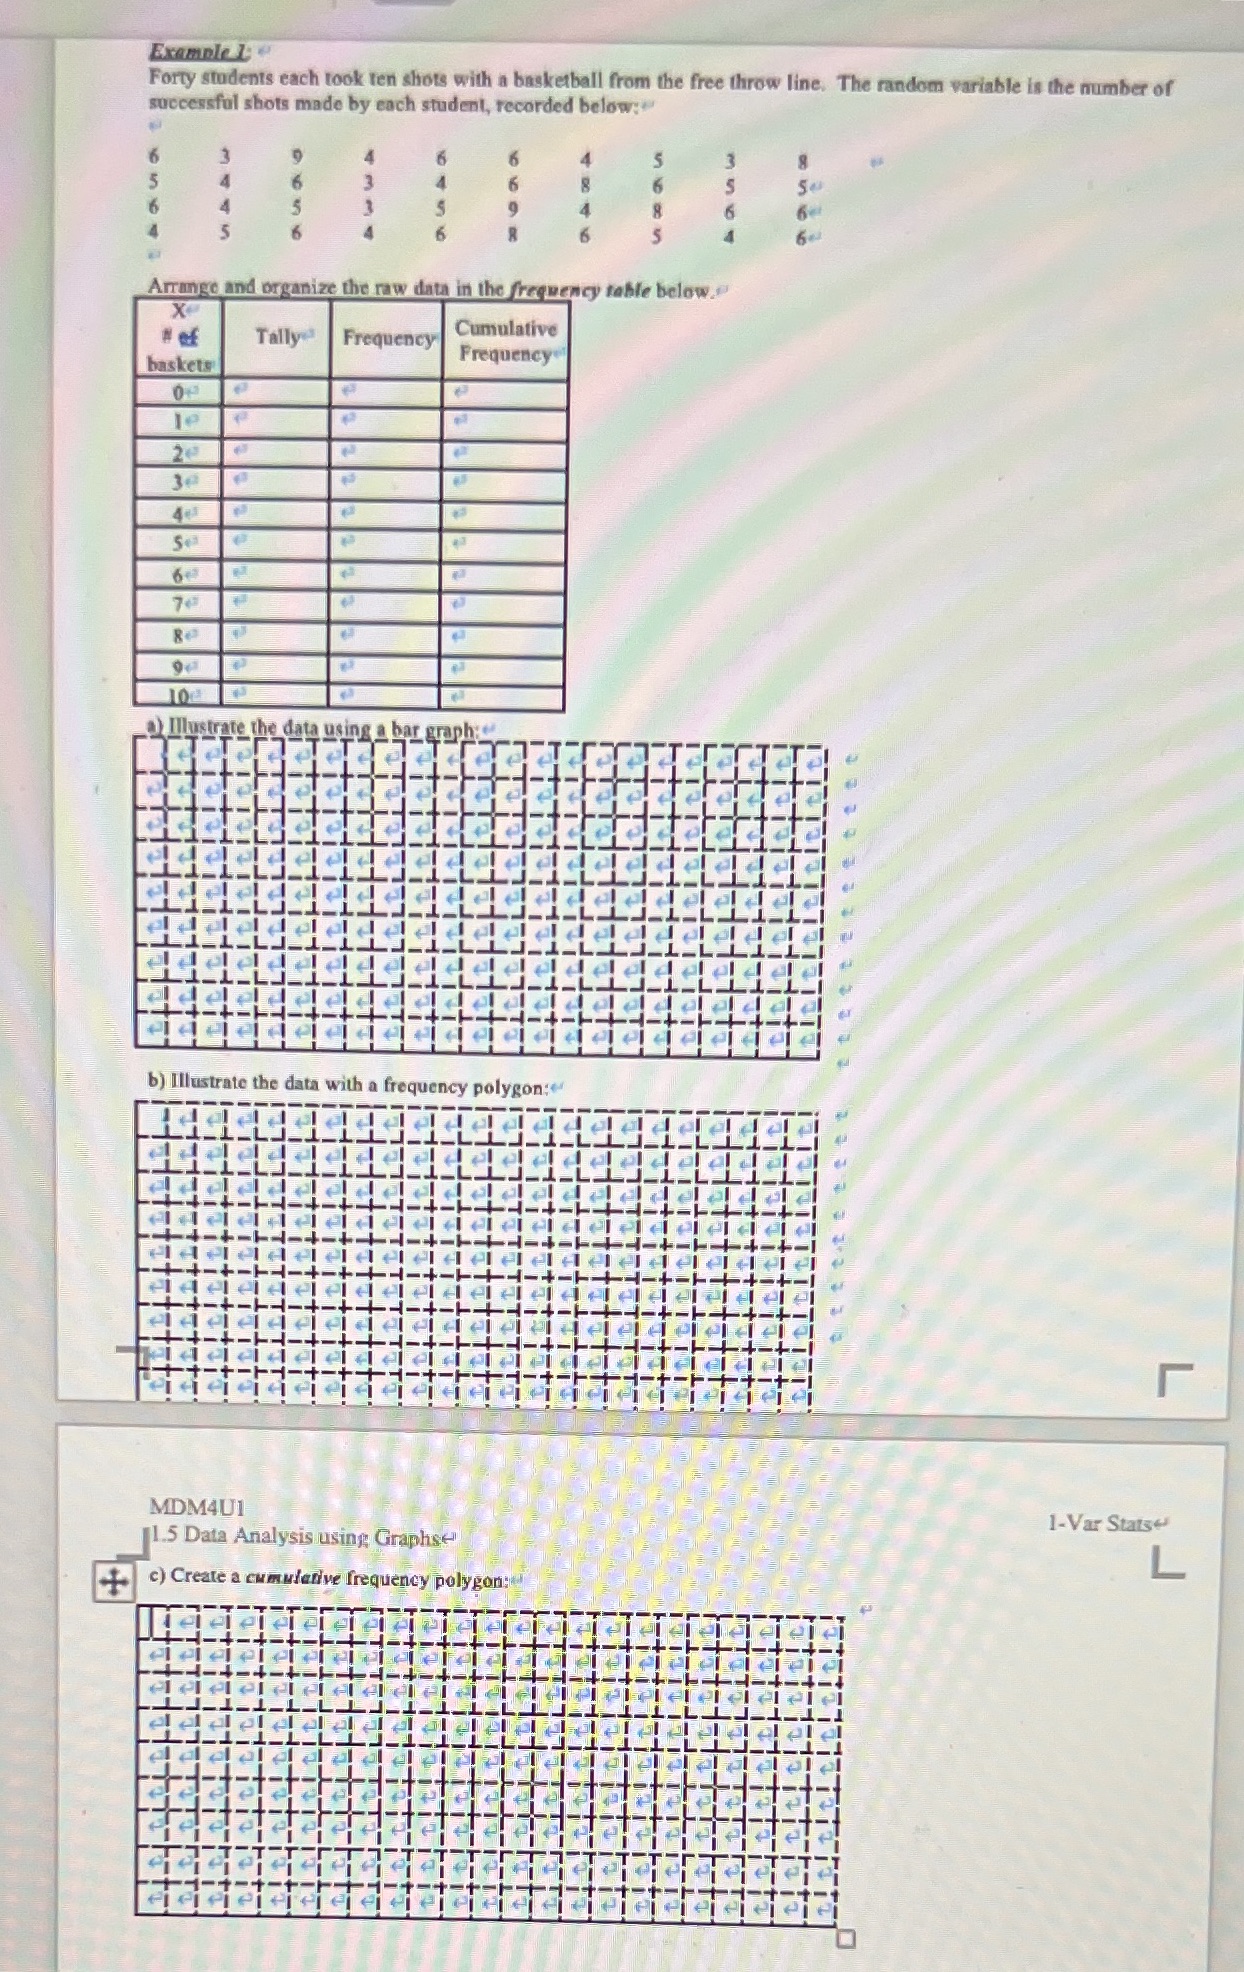
Question about the data analysis Example Le Forty students each took ten shots with a basketball from the free throw line. The random variable is

Question about the data analysis

image text in transcribed
Example Le Forty students each took ten shots with a basketball from the free throw line. The random variable is the number of successful shots made by each student, recorded below: Arrange and organize the raw data in the frequency table below. X of Tally Frequency Cumulative baskets Frequency le 20 ) Illustrate the data using a bar gr b) Illustrate the data with a frequency polygon: r MDM4U1 1-Var Stats 1.5 Data Analysis using Graphs c) Create a cumulative frequency polygon

Step by Step Solution

There are 3 Steps involved in it

Step: 1

blur-text-image

Get Instant Access to Expert-Tailored Solutions

See step-by-step solutions with expert insights and AI powered tools for academic success

Step: 2

blur-text-image

Step: 3

blur-text-image

Ace Your Homework with AI

Get the answers you need in no time with our AI-driven, step-by-step assistance

Get Started

Recommended Textbook for

A Short Course In Automorphic Functions

Authors: Joseph Lehner

1st Edition

0486799921, 9780486799926

More Books

Students also viewed these Mathematics questions

Question

Presentations Approaches to Conveying Information

Answered: 1 week ago