Question: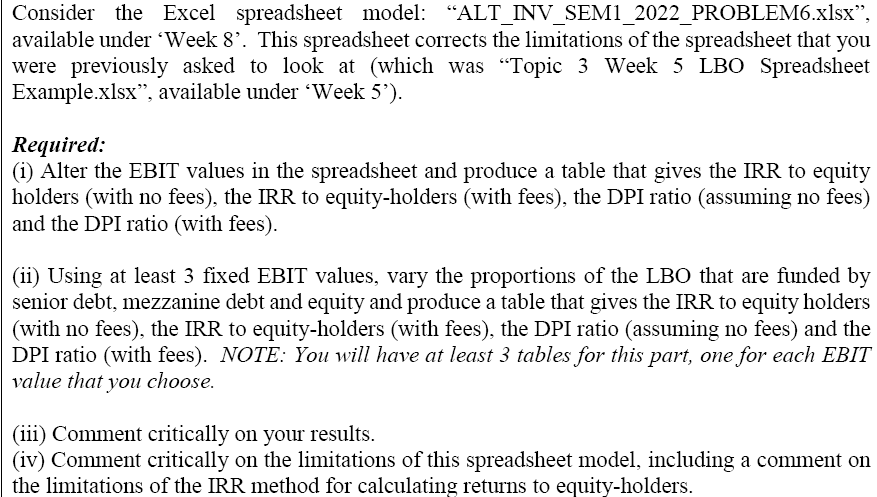
ALT_INV_SEM1_2022_PROBLEM6.xlsx:
Topic 3 Week 5 LBO Spreadsheet Example.xlsx:
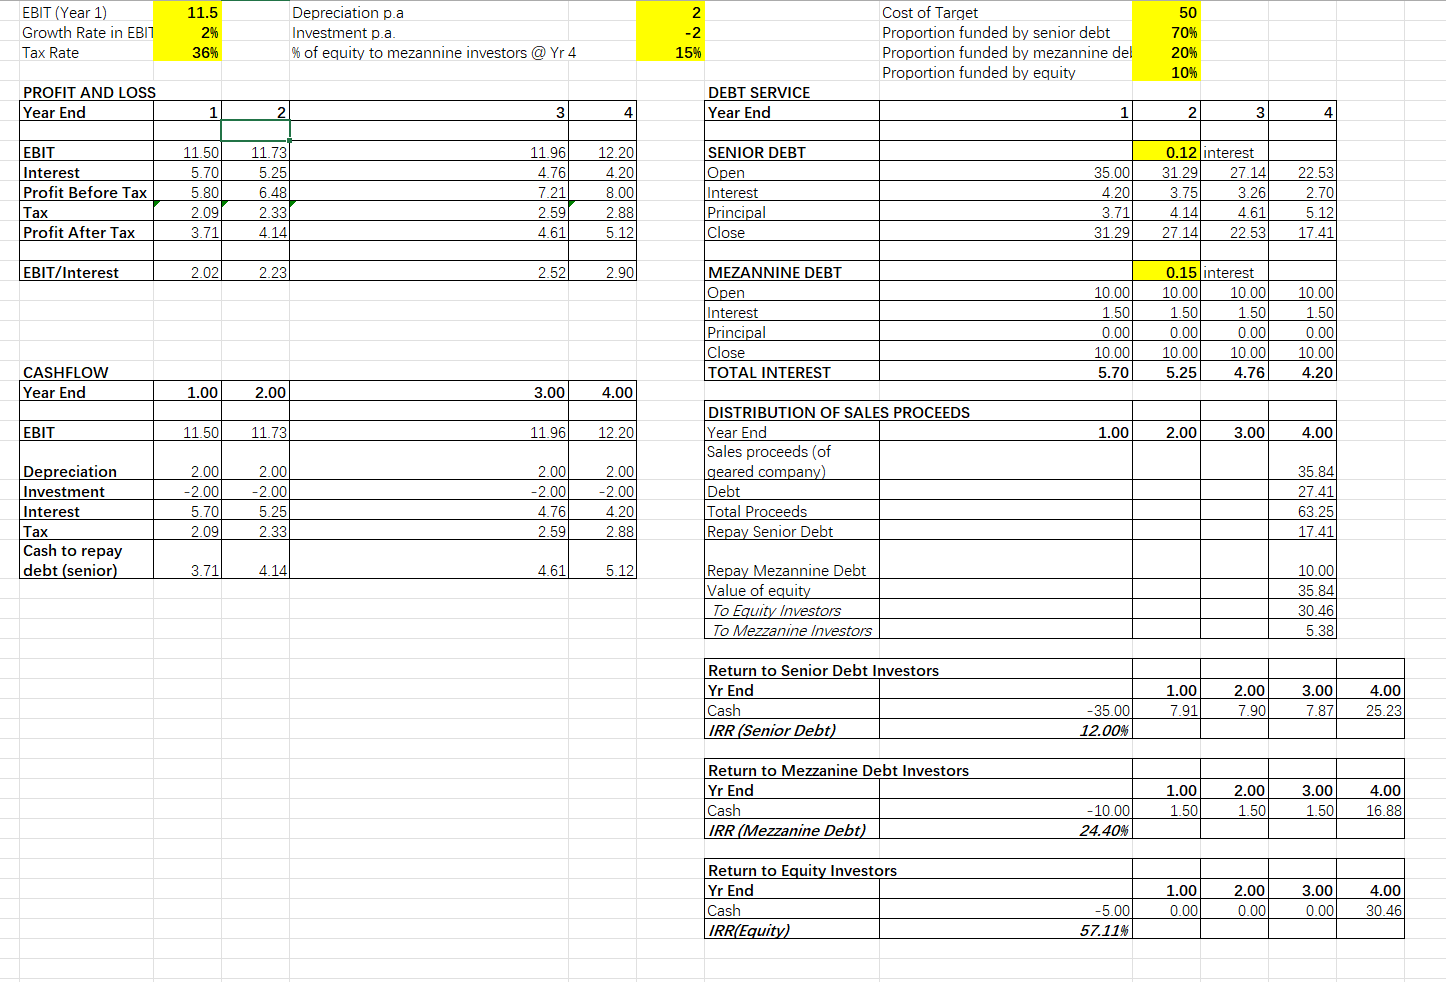
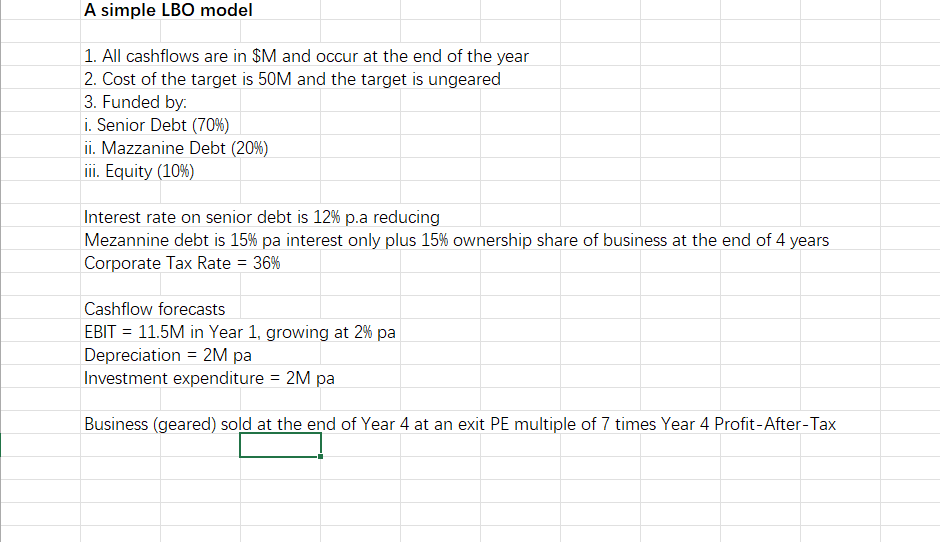
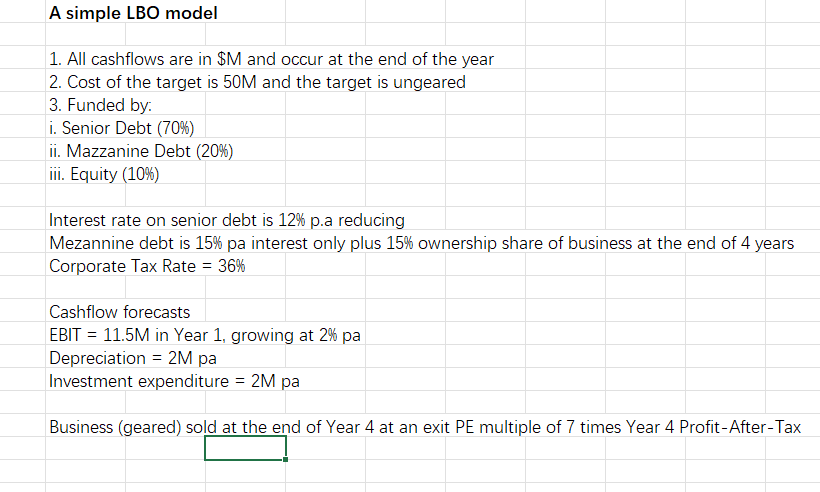
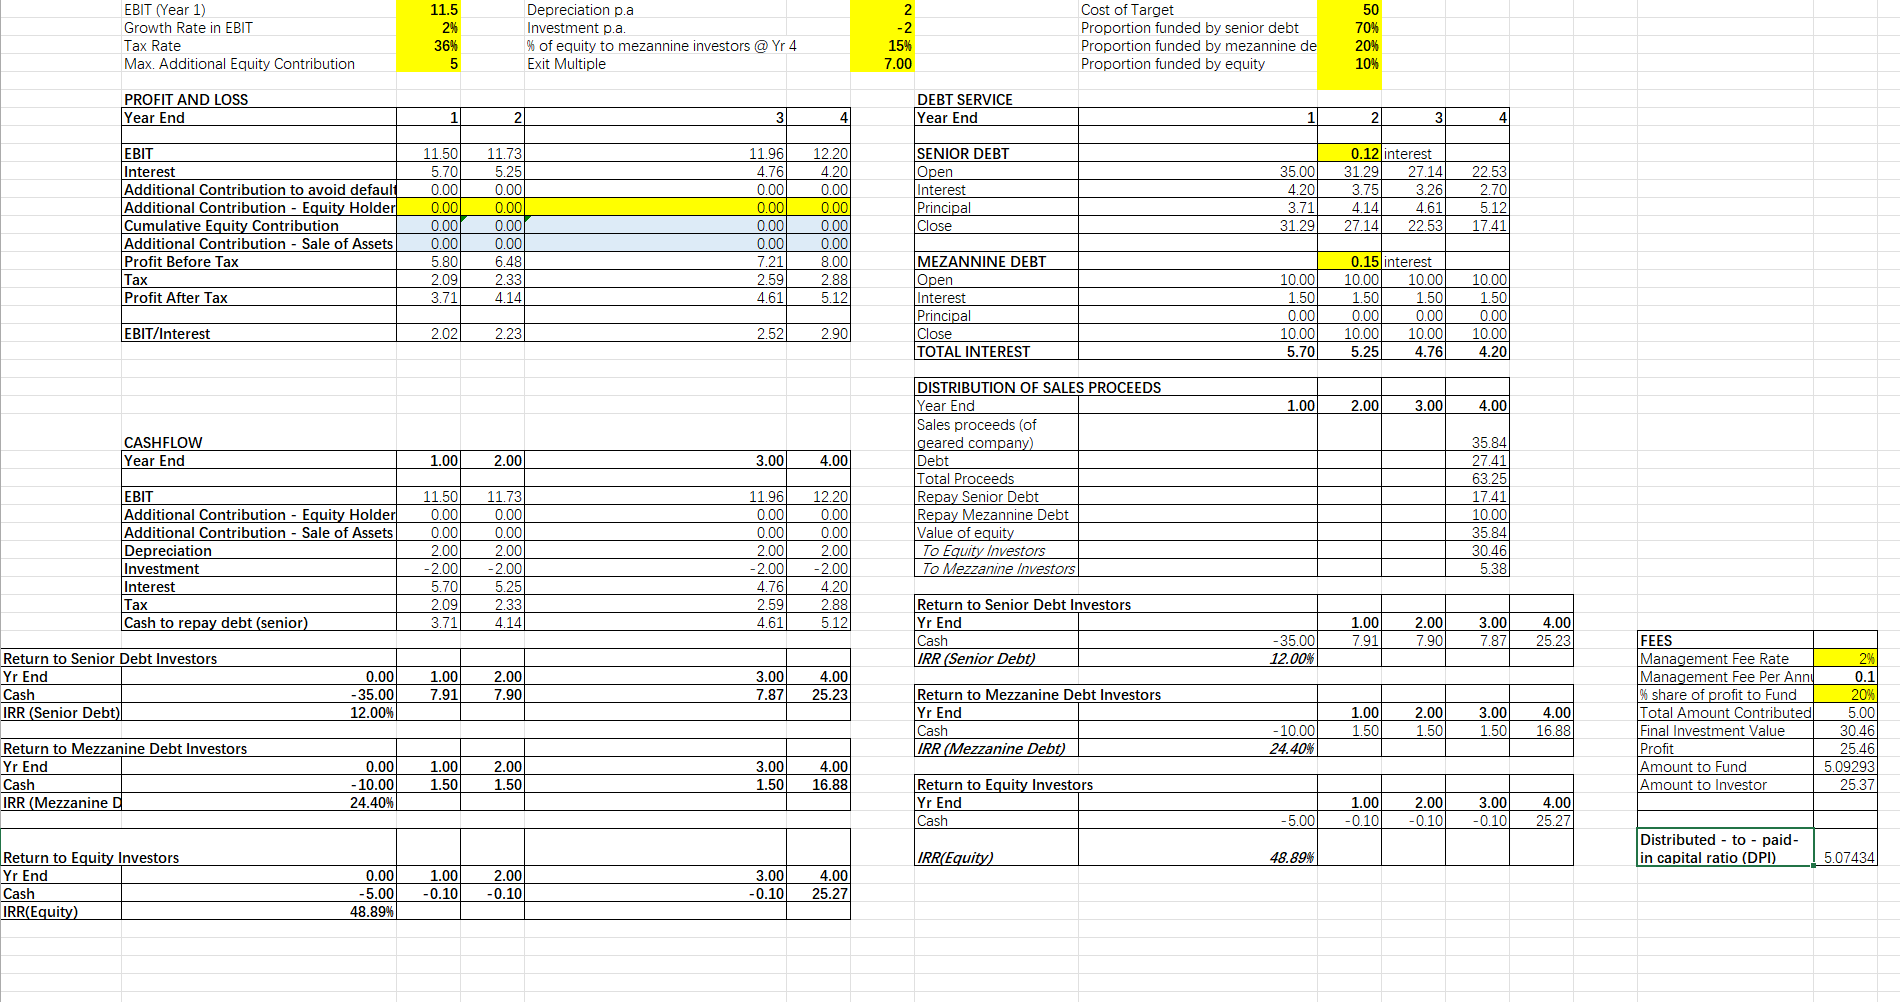
Consider the Excel spreadsheet model: "ALT_INV_SEM1_2022_PROBLEM6.xlsx", available under 'Week 8'. This spreadsheet corrects the limitations of the spreadsheet that you were previously asked to look at (which was "Topic 3 Week 5 LBO Spreadsheet Example.xlsx", available under 'Week 5'). Required: (1) Alter the EBIT values in the spreadsheet and produce a table that gives the IRR to equity holders (with no fees), the IRR to equity-holders (with fees), the DPI ratio (assuming no fees) and the DPI ratio (with fees). (ii) Using at least 3 fixed EBIT values, vary the proportions of the LBO that are funded by senior debt, mezzanine debt and equity and produce a table that gives the IRR to equity holders (with no fees), the IRR to equity-holders (with fees), the DPI ratio (assuming no fees) and the DPI ratio (with fees). NOTE: You will have at least 3 tables for this part, one for each EBIT value that you choose. (iii) Comment critically on your results. (iv) Comment critically on the limitations of this spreadsheet model, including a comment on the limitations of the IRR method for calculating returns to equity-holders. A simple LBO model 1. All cashflows are in $M and occur at the end of the year 2. Cost of the target is 50M and the target is ungeared 3. Funded by: i. Senior Debt (70%) ii. Mazzanine Debt (20%) iii. Equity (10%) Interest rate on senior debt is 12% p.a reducing Mezannine debt is 15% pa interest only plus 15% ownership share of business at the end of 4 years Corporate Tax Rate = 36% Cashflow forecasts EBIT = 11.5M in Year 1, growing at 2% pa Depreciation = 2M pa Investment expenditure = 2M pa Business (geared) sold at the end of Year 4 at an exit PE multiple of 7 times Year 4 Profit-After-Tax EBIT (Year 1) Growth Rate in EBIT Tax Rate Max. Additional Equity Contribution PROFIT AND LOSS Year End EBIT Interest Additional Contribution to avoid default Additional Contribution - Equity Holder Cumulative Equity Contribution Additional Contribution - Sale of Assets Profit Before Tax | Tax Profit After Tax EBIT/Interest CASHFLOW Year End EBIT Additional Contribution - Equity Holder Additional Contribution - Sale of Assets Depreciation Investment Interest | Tax Cash to repay debt (senior) Return to Senior Debt Investors Yr End Cash IRR (Senior Debt) Return to Mezzanine Debt Investors Yr End Cash IRR (Mezzanine D Return to Equity Investors Yr End Cash IRR(Equity) 0.00 -35.00 12.00% 0.00 -10.00 24.40% 0.00 -5.00 48.89% 11.5 Depreciation p.a Investment p.a. 2% 36% % of equity to mezannine investors @ Yr 4 Exit Multiple 5 1 2 3 11.50 11.73 12.20 11.96 4.76 5.70 5.25 4.20 0.00 0.00 0.00 0.00 0.00 0.00 0.00 0.00 0.00 0.00 0.00 0.00 0.00 0.00 0.00 0.00 5.80 6.48 7.21 8.00 2.09 2.33 2.59 2.88 3.71 4.14 4.61 5.12 2.02 2.23 2.52 2.90 1.00 2.00 3.00 4.00 11.50 11.73 11.96 12.20 0.00 0.00 0.00 0.00 0.00 0.00 0.00 0.00 2.00 2.00 2.00 2.00 -2.00 -2.00 -2.00 -2.00 5.70 5.25 4.76 4.20 2.09 2.33 2.59 2.88 3.71 4.14 4.61 5.12 1.00 2.00 7.91 7.90 1.00 2.00 1.50 1.50 1.00 2.00 -0.10 -0.10 3.00 4.00 7.87 25.23 3.00 4.00 1.50 16.88 3.00 4.00 -0.10 25.27 2 -2 15% 7.00 Cost of Target Proportion funded by senior debt Proportion funded by mezannine de Proportion funded by equity 1 35.00 4.20 3.75 3.71 31.29 10.00 1.50 0.00 10.00 5.70 1.00 -35.00 12.00% -10.00 24.40% -5.00 48.89% DEBT SERVICE Year End SENIOR DEBT Open Interest Principal Close MEZANNINE DEBT Open Interest Principal Close TOTAL INTEREST DISTRIBUTION OF SALES PROCEEDS Year End Sales proceeds (of geared company) Debt Total Proceeds Repay Senior Debt Repay Mezannine Debt Value of equity To Equity Investors To Mezzanine Investors Return to Senior Debt Investors Yr End Cash IRR (Senior Debt) Return to Mezzanine Debt Investors Yr End Cash IRR (Mezzanine Debt) Return to Equity Investors Yr End Cash IRR(Equity) 50 70% 20% 10% 21 3 4 0.12 interest 31.29 27.14 22.53 3.26 2.70 4.14 4.61 5.12 27.14 22.53 17.41 0.15 interest 10.00 10.00 10.00 1.50 1.50 1.50 0.00 0.00 0.00 10.00 10.00 10.00 5.25 4.76 4.20 2.00 3.00 4.00 35.84 27.41 63.25 17.41 10.00 35.84 30.46 5.38 1.00 2.00 3.00 4.00 7.91 7.90 7.87 25.23 1.00 1.50 2.00 3.00 4.00 1.50 1.50 16.88 1.00 2.00 3.00 4.00 -0.10 -0.10 -0.10 25.27 FEES Management Fee Rate Management Fee Per Ann % share of profit to Fund Total Amount Contributed Final Investment Value Profit Amount to Fund Amount to Investor Distributed to - paid- in capital ratio (DPI) 2% 0. 20% 5.00 30.46 25.46 5.09293 25.37 5.07434 EBIT (Year 1) Growth Rate in EBIT Tax Rate PROFIT AND LOSS Year End EBIT Interest Profit Before Tax Tax Profit After Tax EBIT/Interest CASHFLOW Year End EBIT Depreciation Investment Interest Tax Cash to repay debt (senior) 11.5 2% 36% 1 11.50 5.70 5.80 2.09 3.71 2.02 1.00 11.50 2.00 -2.00 5.70 2.09 3.71 Depreciation p.a Investment p.a. % of equity to mezannine investors @ Yr 4 2 3 4 11.73 11.96 12.20 5.25 4.76 4.20 6.48 7.21 8.00 2.33 2.59 2.88 4.14 4.61 5.12 2.23 2.52 2.90 3.00 4.00 11.96 12.20 2.00 2.00 -2.00 -2.00 4.76 4.20 2.59 2.88 4.61 5.12 2.00 11.73 2.00 -2.00 5.25 2.33 4.14 2 -2 15% Cost of Target 50 70% Proportion funded by senior debt Proportion funded by mezannine del Proportion funded by equity 20% 10% 1 2 4 0.12 interest 31.29 27.14 35.00 4.20 22.53 2.70 3.75 4.14 3.26 4.61 3.71 31.29 5.12 17.41 27.14 22.53 10.00 10.00 10.00 0.15 interest 10.00 1.50 1.50 0.00 0.00 10.00 10.00 1.50 1.50 0.00 0.00 10.00 10.00 5.70 5.25 4.76 4.20 1.00 2.00 3.00 4.00 35.84 27.41 63.25 17.41 10.00 35.84 30.46 5.38 1.00 3.00 4.00 7.91 7.87 25.23 1.00 3.00 4.00 1.50 1.50 16.88 1.00 3.00 4.00 30.46 0.00 0.00 DEBT SERVICE Year End SENIOR DEBT Open Interest Principal Close MEZANNINE DEBT Open Interest Principal Close TOTAL INTEREST DISTRIBUTION OF SALES PROCEEDS Year End Sales proceeds (of geared company) Debt Total Proceeds Repay Senior Debt Repay Mezannine Debt Value of equity To Equity Investors To Mezzanine Investors Return to Senior Debt Investors Yr End Cash IRR (Senior Debt) Return to Mezzanine Debt Investors Yr End Cash IRR (Mezzanine Debt) Return to Equity Investors Yr End Cash IRR(Equity) -35.00 12.00% -10.00 24.40% -5.00 57.11% 3 2.00 7.90 2.00 1.50 2.00 0.00 A simple LBO model 1. All cashflows are in $M and occur at the end of the year 2. Cost of the target is 50M and the target is ungeared 3. Funded by. i. Senior Debt (70%) ii. Mazzanine Debt (20%) iii. Equity (10%) Interest rate on senior debt is 12% p.a reducing Mezannine debt is 15% pa interest only plus 15% ownership share of business at the end of 4 years Corporate Tax Rate = 36% Cashflow forecasts EBIT = 11.5M in Year 1, growing at 2% pa Depreciation = 2M pa Investment expenditure = 2M pa Business (geared) sold at the end of Year 4 at an exit PE multiple of 7 times Year 4 Profit-After-Tax Consider the Excel spreadsheet model: "ALT_INV_SEM1_2022_PROBLEM6.xlsx", available under 'Week 8'. This spreadsheet corrects the limitations of the spreadsheet that you were previously asked to look at (which was "Topic 3 Week 5 LBO Spreadsheet Example.xlsx", available under 'Week 5'). Required: (1) Alter the EBIT values in the spreadsheet and produce a table that gives the IRR to equity holders (with no fees), the IRR to equity-holders (with fees), the DPI ratio (assuming no fees) and the DPI ratio (with fees). (ii) Using at least 3 fixed EBIT values, vary the proportions of the LBO that are funded by senior debt, mezzanine debt and equity and produce a table that gives the IRR to equity holders (with no fees), the IRR to equity-holders (with fees), the DPI ratio (assuming no fees) and the DPI ratio (with fees). NOTE: You will have at least 3 tables for this part, one for each EBIT value that you choose. (iii) Comment critically on your results. (iv) Comment critically on the limitations of this spreadsheet model, including a comment on the limitations of the IRR method for calculating returns to equity-holders. A simple LBO model 1. All cashflows are in $M and occur at the end of the year 2. Cost of the target is 50M and the target is ungeared 3. Funded by: i. Senior Debt (70%) ii. Mazzanine Debt (20%) iii. Equity (10%) Interest rate on senior debt is 12% p.a reducing Mezannine debt is 15% pa interest only plus 15% ownership share of business at the end of 4 years Corporate Tax Rate = 36% Cashflow forecasts EBIT = 11.5M in Year 1, growing at 2% pa Depreciation = 2M pa Investment expenditure = 2M pa Business (geared) sold at the end of Year 4 at an exit PE multiple of 7 times Year 4 Profit-After-Tax EBIT (Year 1) Growth Rate in EBIT Tax Rate Max. Additional Equity Contribution PROFIT AND LOSS Year End EBIT Interest Additional Contribution to avoid default Additional Contribution - Equity Holder Cumulative Equity Contribution Additional Contribution - Sale of Assets Profit Before Tax | Tax Profit After Tax EBIT/Interest CASHFLOW Year End EBIT Additional Contribution - Equity Holder Additional Contribution - Sale of Assets Depreciation Investment Interest | Tax Cash to repay debt (senior) Return to Senior Debt Investors Yr End Cash IRR (Senior Debt) Return to Mezzanine Debt Investors Yr End Cash IRR (Mezzanine D Return to Equity Investors Yr End Cash IRR(Equity) 0.00 -35.00 12.00% 0.00 -10.00 24.40% 0.00 -5.00 48.89% 11.5 Depreciation p.a Investment p.a. 2% 36% % of equity to mezannine investors @ Yr 4 Exit Multiple 5 1 2 3 11.50 11.73 12.20 11.96 4.76 5.70 5.25 4.20 0.00 0.00 0.00 0.00 0.00 0.00 0.00 0.00 0.00 0.00 0.00 0.00 0.00 0.00 0.00 0.00 5.80 6.48 7.21 8.00 2.09 2.33 2.59 2.88 3.71 4.14 4.61 5.12 2.02 2.23 2.52 2.90 1.00 2.00 3.00 4.00 11.50 11.73 11.96 12.20 0.00 0.00 0.00 0.00 0.00 0.00 0.00 0.00 2.00 2.00 2.00 2.00 -2.00 -2.00 -2.00 -2.00 5.70 5.25 4.76 4.20 2.09 2.33 2.59 2.88 3.71 4.14 4.61 5.12 1.00 2.00 7.91 7.90 1.00 2.00 1.50 1.50 1.00 2.00 -0.10 -0.10 3.00 4.00 7.87 25.23 3.00 4.00 1.50 16.88 3.00 4.00 -0.10 25.27 2 -2 15% 7.00 Cost of Target Proportion funded by senior debt Proportion funded by mezannine de Proportion funded by equity 1 35.00 4.20 3.75 3.71 31.29 10.00 1.50 0.00 10.00 5.70 1.00 -35.00 12.00% -10.00 24.40% -5.00 48.89% DEBT SERVICE Year End SENIOR DEBT Open Interest Principal Close MEZANNINE DEBT Open Interest Principal Close TOTAL INTEREST DISTRIBUTION OF SALES PROCEEDS Year End Sales proceeds (of geared company) Debt Total Proceeds Repay Senior Debt Repay Mezannine Debt Value of equity To Equity Investors To Mezzanine Investors Return to Senior Debt Investors Yr End Cash IRR (Senior Debt) Return to Mezzanine Debt Investors Yr End Cash IRR (Mezzanine Debt) Return to Equity Investors Yr End Cash IRR(Equity) 50 70% 20% 10% 21 3 4 0.12 interest 31.29 27.14 22.53 3.26 2.70 4.14 4.61 5.12 27.14 22.53 17.41 0.15 interest 10.00 10.00 10.00 1.50 1.50 1.50 0.00 0.00 0.00 10.00 10.00 10.00 5.25 4.76 4.20 2.00 3.00 4.00 35.84 27.41 63.25 17.41 10.00 35.84 30.46 5.38 1.00 2.00 3.00 4.00 7.91 7.90 7.87 25.23 1.00 1.50 2.00 3.00 4.00 1.50 1.50 16.88 1.00 2.00 3.00 4.00 -0.10 -0.10 -0.10 25.27 FEES Management Fee Rate Management Fee Per Ann % share of profit to Fund Total Amount Contributed Final Investment Value Profit Amount to Fund Amount to Investor Distributed to - paid- in capital ratio (DPI) 2% 0. 20% 5.00 30.46 25.46 5.09293 25.37 5.07434 EBIT (Year 1) Growth Rate in EBIT Tax Rate PROFIT AND LOSS Year End EBIT Interest Profit Before Tax Tax Profit After Tax EBIT/Interest CASHFLOW Year End EBIT Depreciation Investment Interest Tax Cash to repay debt (senior) 11.5 2% 36% 1 11.50 5.70 5.80 2.09 3.71 2.02 1.00 11.50 2.00 -2.00 5.70 2.09 3.71 Depreciation p.a Investment p.a. % of equity to mezannine investors @ Yr 4 2 3 4 11.73 11.96 12.20 5.25 4.76 4.20 6.48 7.21 8.00 2.33 2.59 2.88 4.14 4.61 5.12 2.23 2.52 2.90 3.00 4.00 11.96 12.20 2.00 2.00 -2.00 -2.00 4.76 4.20 2.59 2.88 4.61 5.12 2.00 11.73 2.00 -2.00 5.25 2.33 4.14 2 -2 15% Cost of Target 50 70% Proportion funded by senior debt Proportion funded by mezannine del Proportion funded by equity 20% 10% 1 2 4 0.12 interest 31.29 27.14 35.00 4.20 22.53 2.70 3.75 4.14 3.26 4.61 3.71 31.29 5.12 17.41 27.14 22.53 10.00 10.00 10.00 0.15 interest 10.00 1.50 1.50 0.00 0.00 10.00 10.00 1.50 1.50 0.00 0.00 10.00 10.00 5.70 5.25 4.76 4.20 1.00 2.00 3.00 4.00 35.84 27.41 63.25 17.41 10.00 35.84 30.46 5.38 1.00 3.00 4.00 7.91 7.87 25.23 1.00 3.00 4.00 1.50 1.50 16.88 1.00 3.00 4.00 30.46 0.00 0.00 DEBT SERVICE Year End SENIOR DEBT Open Interest Principal Close MEZANNINE DEBT Open Interest Principal Close TOTAL INTEREST DISTRIBUTION OF SALES PROCEEDS Year End Sales proceeds (of geared company) Debt Total Proceeds Repay Senior Debt Repay Mezannine Debt Value of equity To Equity Investors To Mezzanine Investors Return to Senior Debt Investors Yr End Cash IRR (Senior Debt) Return to Mezzanine Debt Investors Yr End Cash IRR (Mezzanine Debt) Return to Equity Investors Yr End Cash IRR(Equity) -35.00 12.00% -10.00 24.40% -5.00 57.11% 3 2.00 7.90 2.00 1.50 2.00 0.00 A simple LBO model 1. All cashflows are in $M and occur at the end of the year 2. Cost of the target is 50M and the target is ungeared 3. Funded by. i. Senior Debt (70%) ii. Mazzanine Debt (20%) iii. Equity (10%) Interest rate on senior debt is 12% p.a reducing Mezannine debt is 15% pa interest only plus 15% ownership share of business at the end of 4 years Corporate Tax Rate = 36% Cashflow forecasts EBIT = 11.5M in Year 1, growing at 2% pa Depreciation = 2M pa Investment expenditure = 2M pa Business (geared) sold at the end of Year 4 at an exit PE multiple of 7 times Year 4 Profit-After-Tax


