Question
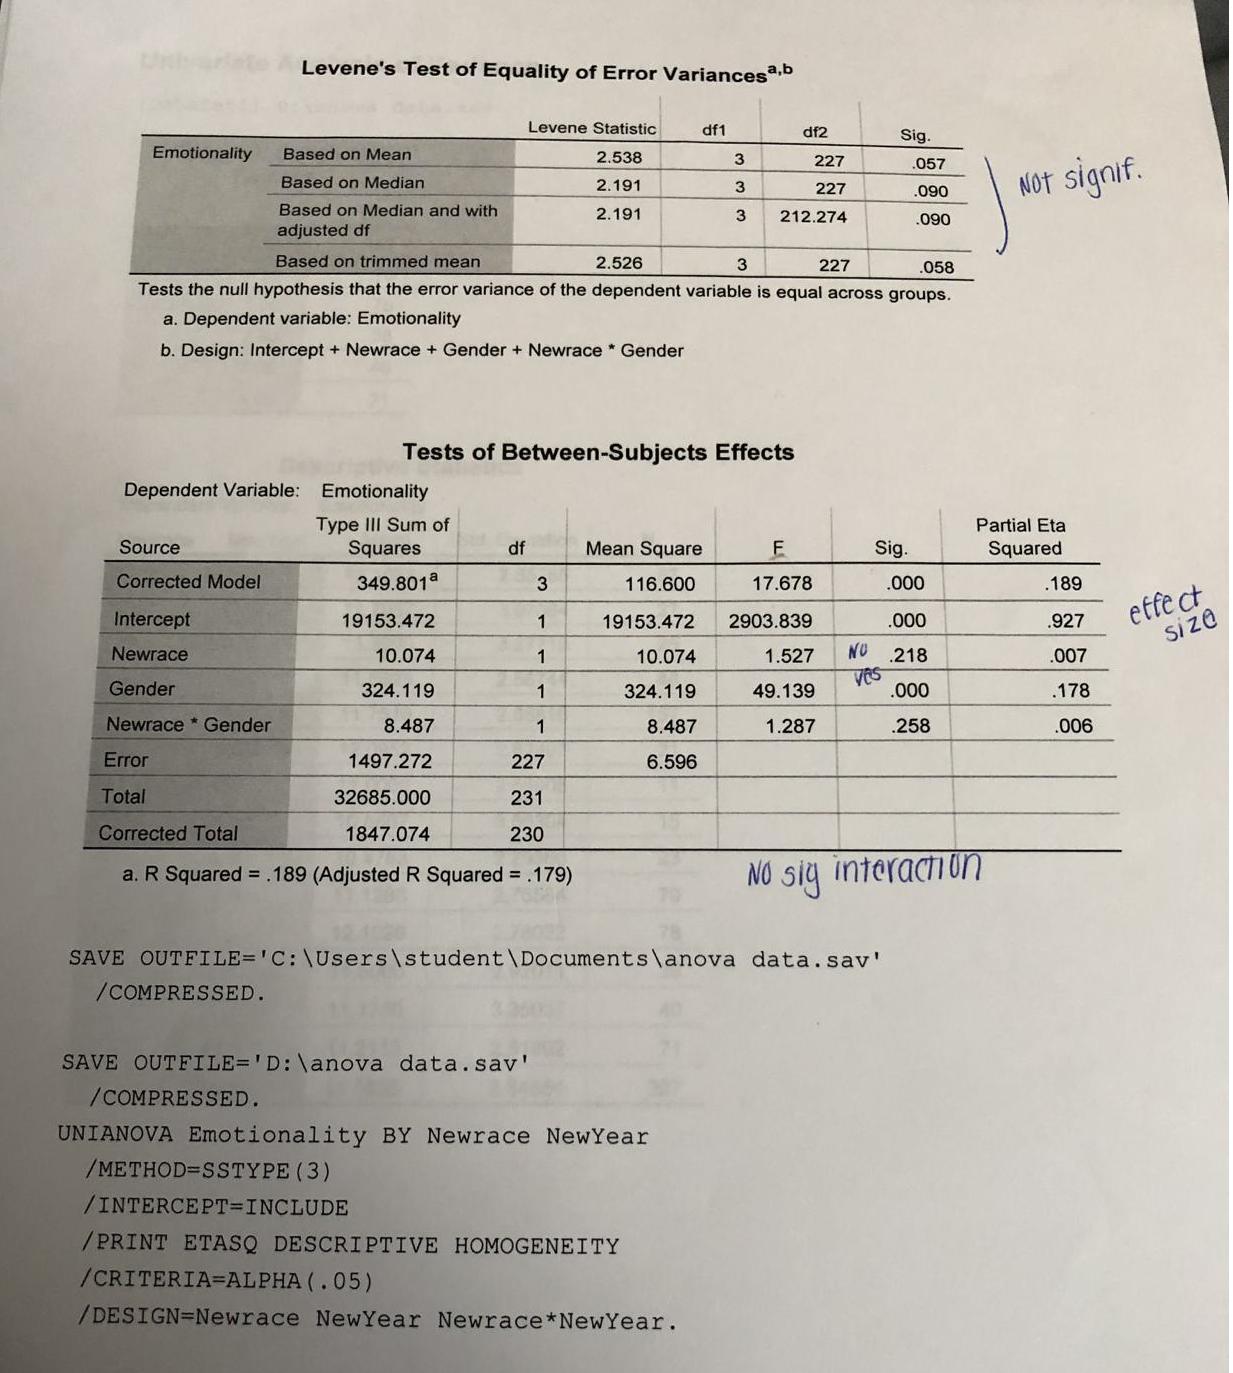
Using the results, fill in the Anova results with the correct information first we are comparing gender and race (independent variables) dependent: emotionality second, we
Using the results, fill in the Anova results with the correct information first we are comparing gender and race (independent variables) dependent: emotionality second, we are comparing year in school and race (independent variables) dependent: emotionality for the interaction part, there wasn't an interaction. instead state, " there was no interaction, however if there were"
ANOVA
A sample ANOVA to the question and the results:
ANOVA Results example
· A 2 (emotionality) x 2 (gender) Between subjects' analysis of variance was conducted with the number of words recalled as the dependent variable. Assumptions concerning homogeneity of variance, independent samples, and normal populations were me.
· A 2 (emotionality) x 2 (race) Between subjects' analysis of variance was conducted with the number of words recalled as the dependent variable. Assumptions concerning homogeneity of variance, independent samples, and normal populations were me.
· Interaction: individuals given a free recall task recalled the same number of words regardless of whether the words were related (m=55) or unrelated (M=55) or unrelated (M=55). On the other hand, individuals given a paired associate task recalled more related words (M=45) versus unrelated words (M=30)
Main effects:
· There was a main effect of A such that individuals recalled more words when given a free recall task (M=55) than when given a paired associate task (M=42.5) F (1,230) =4.52, p<.05.
· There was also a main effect of B such that individuals recalled more words when those words were related (M=50) than unrelated (M=42.5)
Degrees of freedom for the variable and degrees of error for the second number (1,227)
Separating females in one line vs males
*****

Levene's Test of Equality of Error Variancesa,b Levene Statistic df1 df2 Emotionality Based on Mean 2.538 227 .057 Based on Median 2.191 227 .090 Based on Median and with 2.191 212.274 .090 adjusted df Based on trimmed mean 2.526 3 227 .058 Tests the null hypothesis that the error variance of the dependent variable is equal across groups. a. Dependent variable: Emotionality b. Design: Intercept + Newrace + Gender + Newrace Gender Tests of Between-Subjects Effects Dependent Variable: Emotionality Type III Sum of Squares Source df Mean Square 116.600 F 17.678 Corrected Model 349.801a 3 Intercept 19153.472 1 19153.472 2903.839 Newrace 10.074 1 10.074 Gender 324.119 1 324.119 Newrace Gender 8.487 1 8.487 Error 1497.272 227 6.596 Total 32685.000 231 Corrected Total 1847.074 230 a. R Squared = .189 (Adjusted R Squared = .179) SAVE OUTFILE='C:\Users\student\Documents\anova data.sav' /COMPRESSED. SAVE OUTFILE='D:\anova data.sav' /COMPRESSED. UNIANOVA Emotionality BY Newrace New Year /METHOD=SSTYPE (3) /INTERCEPT=INCLUDE /PRINT ETASQ DESCRIPTIVE HOMOGENEITY /CRITERIA-ALPHA (.05) /DESIGN=Newrace NewYear Newrace *NewYear. 3 3 3 Sig. Sig. .000 Not signif. Partial Eta Squared .000 1.527 NO .218 ves 49.139 .000 1.287 .258 NO sig interaction .189 .927 .007 .178 .006 effect size
Step by Step Solution
3.66 Rating (176 Votes )
There are 3 Steps involved in it
Step: 1
The ANOVA is already filled based on the image you attached ...
Get Instant Access to Expert-Tailored Solutions
See step-by-step solutions with expert insights and AI powered tools for academic success
Step: 2

Step: 3

Ace Your Homework with AI
Get the answers you need in no time with our AI-driven, step-by-step assistance
Get Started


