question are down below:
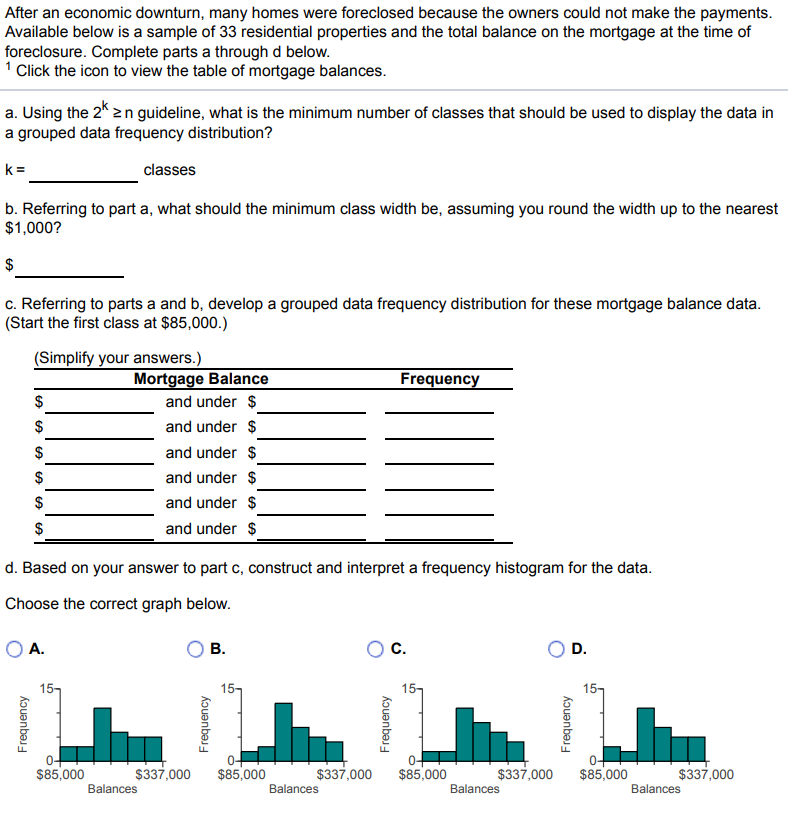
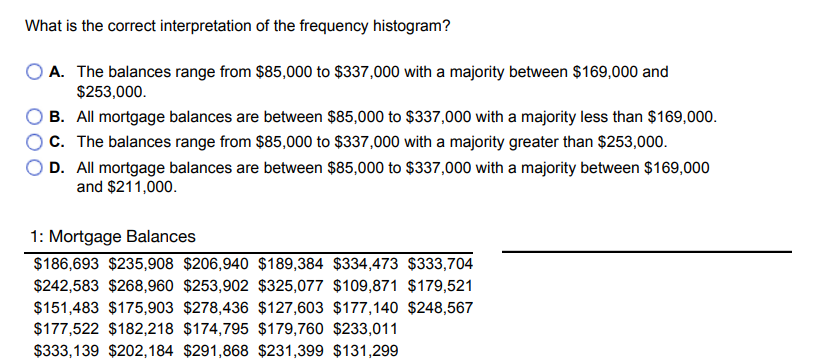
After an economic downturn, many homes were foreclosed because the owners could not make the payments. Available below is a sample of 33 residential properties and the total balance on the mortgage at the time of foreclosure. Complete parts a through d below. Click the icon to view the table of mortgage balances. a. Using the 2 2n guideline, what is the minimum number of classes that should be used to display the data in a grouped data frequency distribution? K= classes b. Referring to part a, what should the minimum class width be, assuming you round the width up to the nearest $1,000? $ c. Referring to parts a and b, develop a grouped data frequency distribution for these mortgage balance data. (Start the first class at $85,000.) (Simplify your answers.) Mortgage Balance Frequency and under $ and under $ and under $ and under $ and under $ and under $ d. Based on your answer to part c, construct and interpret a frequency histogram for the data. Choose the correct graph below. O A. O B. O c. OD. 15- 15- 15- Frequency 15- Frequency Frequency Frequency 0- $85,000 0- $337,000 $85,000 0- $337,000 $85,000 $337,000 0- $85,000 $337,000 Balances Balances Balances BalancesWhat is the correct interpretation of the frequency histogram? O A. The balances range from $35,000 to $33?,000 with a majority bebnreen $103,000 and $253,000. 0 B. All mortgage balances are between $05,000 to $337,000 with a majority less than $133,000. 0 C. The balances range from $35,000 to $331000 with a majority greater than $253,000. 0 D. All mortgage balances are between $35,000 to $33?,000 with a majority between $133,000 and $211,000. 1: Mortgage Balances $133,333 $235,303 $203,340 $133,334 $334,473 $333,704 3242.533 $233330 $253,302 $325,077 $103,371 $173,521 $151,433 $175,303 $273,433 $127,303 $177,140 $243,537 $177,522 $132,213 $174,735 $173,730 $233,011 $333,133 $202,134 $231,303 $231,333 $131,233