Answered step by step
Verified Expert Solution
Link Copied!

Question

1 Approved Answer

Question below: You have completed a survey of 1,000 voters from the 2020 election. For each voter, you record the following variables: Quantity measured Variable

Question below:
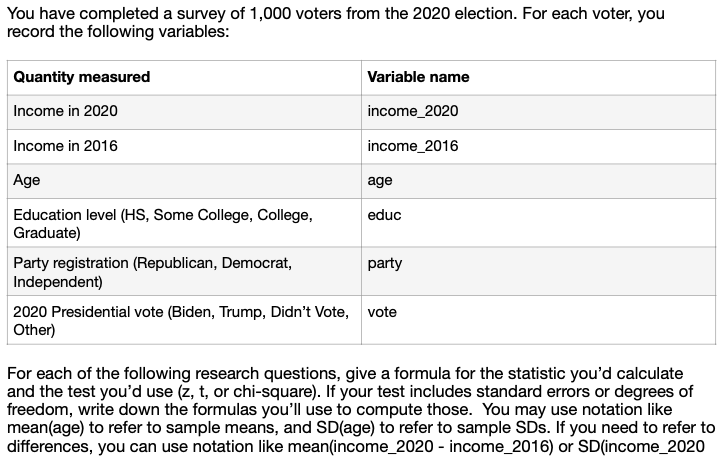
image text in transcribedimage text in transcribed
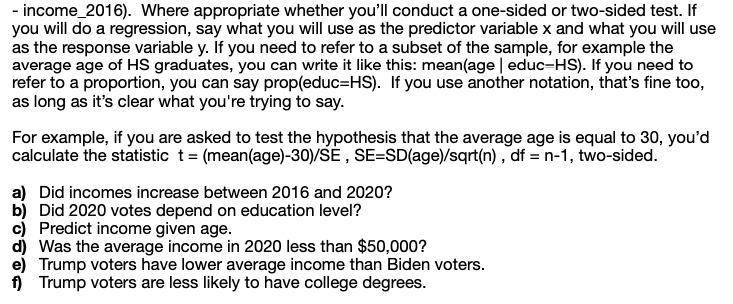
You have completed a survey of 1,000 voters from the 2020 election. For each voter, you record the following variables: Quantity measured Variable name Income in 2020 income_2020 Income in 2016 income_2016 Age age Education level (HS, Some College, College, educ Graduate) Party registration (Republican, Democrat, party Independent) 2020 Presidential vote (Biden, Trump, Didn't Vote, vote Other) For each of the following research questions, give a formula for the statistic you'd calculate and the test you'd use (z, t, or chi-square). If your test includes standard errors or degrees of freedom, write down the formulas you'll use to compute those. You may use notation like mean(age) to refer to sample means, and SD(age) to refer to sample SDs. If you need to refer to differences, you can use notation like mean(income_2020 - income_2016) or SD(income_2020- income_21}. 1Where appropriate whether you'll conduct a one-sided or two-sided test. If you will do a regression, sayr what you will use as the predictor variable x and what you will use as the response variable y. If you need to refer to a subset of the sample, for example the average age of H3 graduates, you can write it like this: mean{age | educ=HS}. If you need to refer to a proportion, you can say propeduc= H8]. If you use another notation, that's fine too, as long as it's clear what you're trying to say. For example, if you are asked to test the hypothesis that the average age is equal to 30, you'd calculate the statistic t: {meanEageJ-SDVSE , SE=SD{age}fsqrt[n} , df = n-1, two-sided. a} Did incomes increase between 2016 and 2020? b] Did 202D votes depend on education level? c} Predict income given age. d] Was the average income in 2020 less than $5D,DDD? e} TnJmp voters have lower average income than Biden voters. TnJmp voters are less likely to have college degrees

Step by Step Solution

There are 3 Steps involved in it

Step: 1

blur-text-image

Get Instant Access to Expert-Tailored Solutions

See step-by-step solutions with expert insights and AI powered tools for academic success

Step: 2

blur-text-image

Step: 3

blur-text-image

Ace Your Homework with AI

Get the answers you need in no time with our AI-driven, step-by-step assistance

Get Started

Recommended Textbook for

Quantitative Analysis For Management

Authors: Barry Render, Ralph M. Stair, Michael E. Hanna

11th Edition

9780132997621, 132149117, 132997622, 978-0132149112

Students also viewed these Mathematics questions