Question Bilzerian focused on exporting as his mode of entry. Is that the only or best way to enter Do the election criteria change if a different mode of entry is employed.
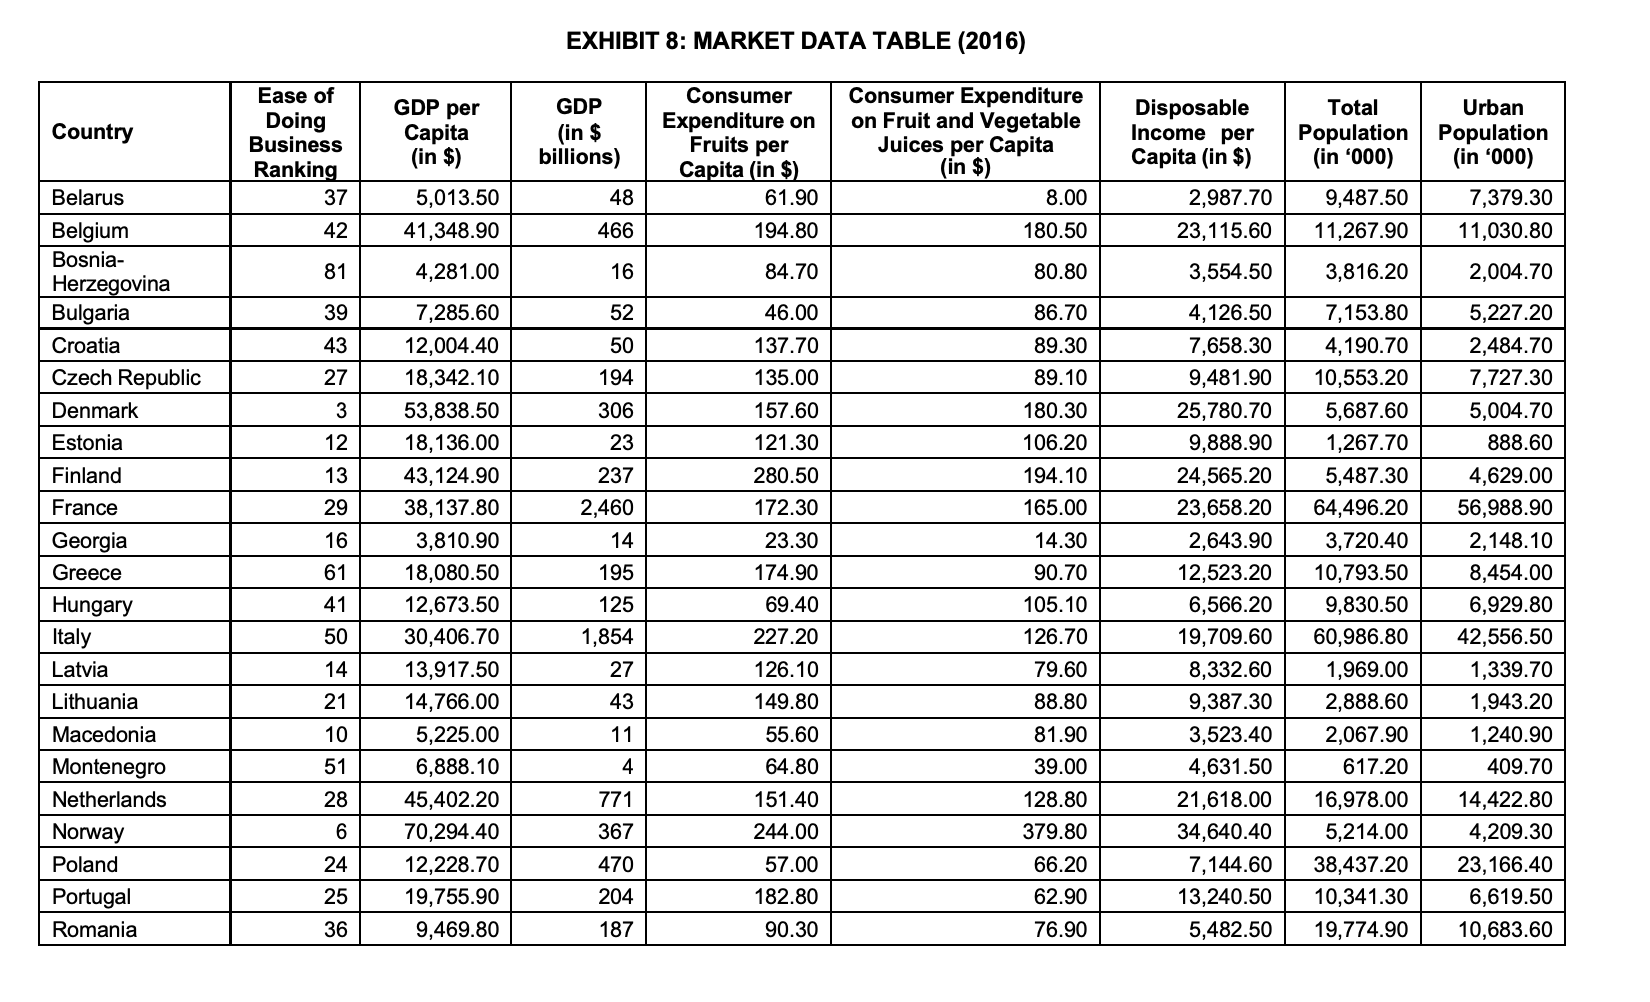
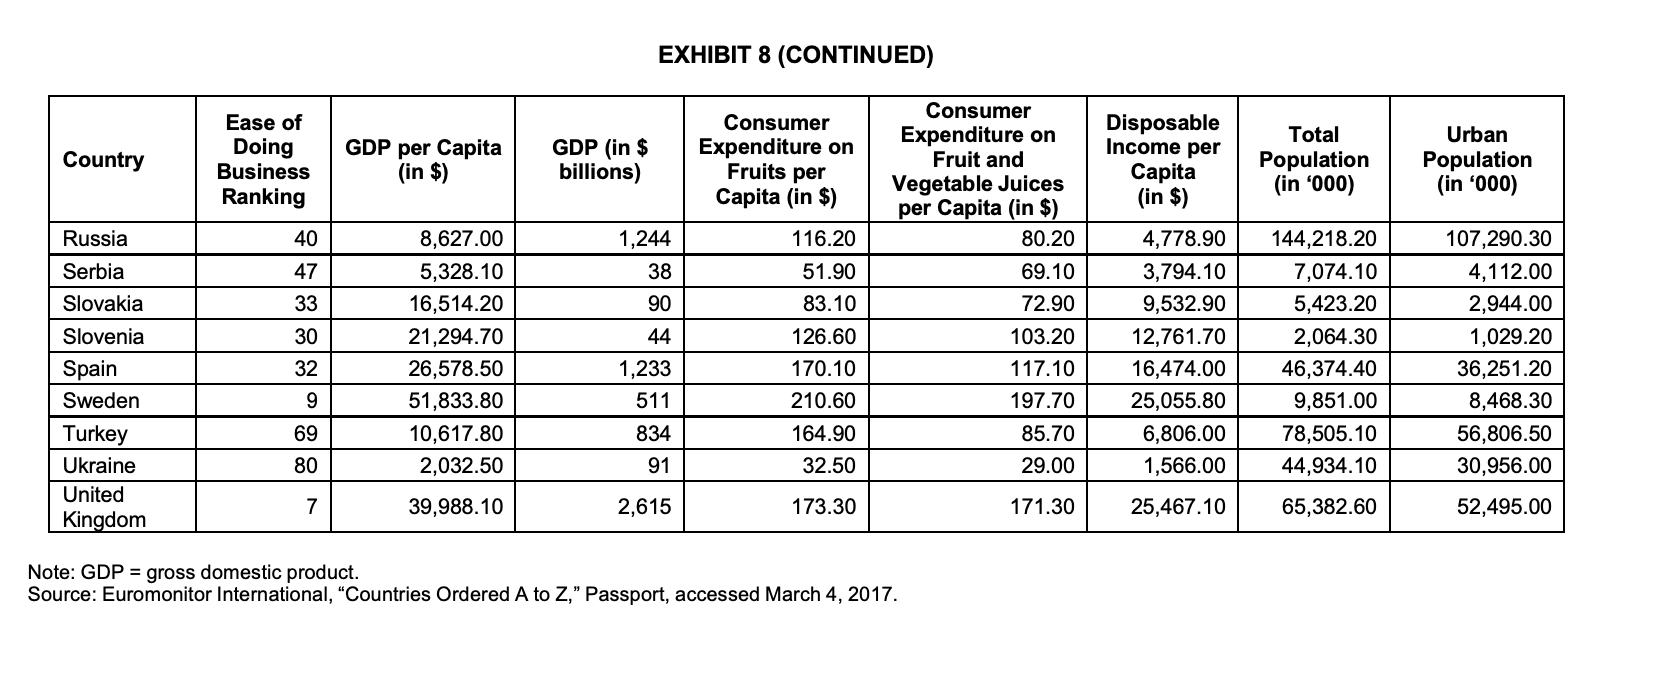
Concentration of the Industry The industry showed an increase in the consumption of smoothies since 2007. Globally, the industry was projected to grow at a compounded annual growth rate (CAGR) of 7.1 per cent until 2020.12 In 2016, the United States represented the biggest market of the global smoothie market, in terms of sales and revenue. Asia-Pacic was expected to grow by a CAGR of 9.1 per cent until 2022.13 This was attributed to a growth in the middle class, the Westernization of food consumption, and growing health consciousness stemming from rising levels of obesity. The consumption of 'uit juice was regarded as an effective way to lose weight. Because 'uit juices were favoured in warmer climatic conditions, countries in Asia with a close proximity to the equator were projected to incur signicant increases in the consumption of fruit juice in the years following 2016. When applying the climatic concept to the United States, the smoothie industry would be concentrated mainly in the southeast and the southwest. With daily weather volatility, the climate made the industry highly seasoual. In general, a warmer environment fostered the sale of smoothies. California, Florida, and Texas were the top three regions in terms of number of smoothie industry locations in the United States, with 20.1 per cent, 16.] per cent, and 10.4 per cent of locations, respectively. In Europe, southern countries featured the ideal climatic conditions; however, as mentioned, climate was not the only factor determining smoothie consumption. Competition The existence of thousands of smoothie companies globally was due to low capital intensity in the industry, which decreased switching costs for consumers. Among the largest players were Barfresh Food Group, Bolthouse Farms, Boost Juice Bars, Crush Juice Bars, Freshens, Innocent, Jamba Juice, and Smoothie King. '1 Richard Lazazzera, "Infographic: The Most Popular Smoothie in North America,\" Vivonet, October 3, 2012, accessed October 4, 2017, www.vivonet.comfbloglbidl1597641infographic-the-mostpopular-smoothieinnorthamerica. '2 Laura Wood, \"Global Smoothies Market Growth of 7.1 % CAGR by 2020Analysis, Technologies & Forecasts Report 2016 2020Key Vendors: Bolthouse Farms, Innocent Drinks, Suja JuiceResearch and Markets," Business Wire, July 5. 2016, accessed October 4, 201 7, www.businesswire.oomfnewslhomel20160705005722leanlobal-SmoothiesMarket-GrowthT.1-CAGR2020. '3 Global Industry Analysts, op. cit. For example, in the U.S. market, the two major players, Jamba Juice (23.6 per cent market share) and Smoothie King (10.3 per cent market share), made up roughly onethird of the US. smoothie industry.14 Jamba Juice was the only publicly traded corporation within the industry. The corporation had over 800 locations worldwide, most of which were franchises. The rm operated two types of stores in the United States: traditional stores, which were located in major urban centres, and non-traditional stores, which were based within another business or institution. 0n the other hand, Smoothie King had a more international presence, with 100 locations outside the United States, in addition to the 700 stores it had within the United States. The company intended to expand mainly into developing countries within Asia, with the intention of using the growth of these nations to the company's advantage. The thirdlargest company was Maui Wowi Hawaiian Coffees & Smoothies, with an estimated 3.2 per cent market share, followed by Robeks, with an estimated market share of 1.6 per cent. The remaining 61.3 per cent of the market was shared by smaller players, which suggested a low market concentration.\" The majority of smoothie stores were independently owned in a local geographic market. Therefore, a key to success for smoothie companies was ease of access for the customer. Highly populated areas had the greatest number of customers, as well as the greatest number of new stores, owing to new trends in healthy lifestyles, such as eating organic foods. For a company with limited resources for its own franchise, becoming a franchisee suggested a relatively low risk and was an easy option to enter markets. Lastly, efcient inventory management was a factor in helping a smoothie bar stock supplies properly and thereby maximize its margins and revenue. Longevity and loyalty were competitive advantages for the big companies; however, these values did not have an impact on the competition between local players. Customers were willing to pay higher prices for premium products. Cost structures varied widely among industry players, depending on the number of locations they had, their ownership structure, and the number of customers the business location attracted. In general, rms with regular clients tended to be more protable. A typical cost breakdown was 38.8 per centcosts of goods sold; 23.1 per centwages; 12.5 per centrent and utilities; and 19 per centother costs, including marketing expenses, depreciation, and insurance costs, leaving an estimated 6.6 per cent earnings before interest and taxes.\"3 Noteworthy was the uctuation of fruit and vegetables prices, which could not be passed on to the consumer, and waste generated as a result of inefcient inventory management. It was, therefore, essential for companies to monitor their menus and other food inputs continuously. Developments in technology enhanced communication with suppliers and enabled greater efciency in supply chain management. In contrast to the uctuation in prices for ingredients, prices for packaging materials were constant; there were a large number of suppliers and they produced very similar products. The increase in global demand for fresh fruits and vegetables raised smoothie producers' prices, but they managed to slightly increase their margins between 2011 and 2016 by about 6.6 per cent.\" Nevertheless, consumers were likely to substitute the high-cost product for lowcost drinks, or make their own smoothies when the price increased too much. An increase in external competitionfrom retailers and coffee shops, for exampleadded a tremendous threat of new entrants to the smoothie industry. Not only did cold pressed juices become more popular because of their longer shelf lives, but Starbucks Corporation also entered the market, beginning with its acquisition of Evolution Fresh for $30 million in 2011.18 Globally, franchising had been the major source of expansion for leading smoothie companies. A company's networks provided special assistance based on the -anchisee's location; for example, stores located in close proximity to tness centres could adapt their products by adding healthy options containing protein supplements. This made it easier for companies to expand into new venues such as grocery stores, colleges, airports, and many other locations. Local stores were expected to face increased competition from major players in the smoothie industry due to the latter's supply chain advantages in minimizing costs. Future Trends Industry analysis suggested that juices and smoothies with high sugar content would become less favourable to consumers. For example, orange juice and lemonade had seen decreases in consumption in recent years due to consumers' increased health consciousness and awareness of childhood obesity. Companies producing exotic drinks and smoothies beneted from this, and it sparked a new subcategory, namely cold- pressed juice. This niche segment used technology that yielded a higher nutritional content without the addition of any supplemental products. Because a higher quality of fruit was needed for coldpressed juice, the demand was expected to lead to an increase in the price of fruits in the next few years. Nongenetically modied organisms, highbre, and organic smoothies had increased in popularity during recent years and were projected to continue doing so in the future.19 Smoothie industry projections could be taken even a step further: green juices were being used as a meal replacement and for cleansing diets, and it was expected that many smoothie producers would capitalize on this trend in developed markets, offering smoothie bowls as a substitute for ice cream or breakfast cereals. This trend could potentially open an entirely new market, and it had shown tremendous future expansion potential. WHERE TO GO NEXT Against this background, Knauf, Koster, and Lecloux moved forward with their plans for international expansion and hired Daniel Aminati Bilzerian, a young and enthusiastic strategic manager, in the second quarter of 2017. Bilzerian was placed in charge of international expansion under the supervision of Lecloux. Due to increasing competition and rising fruit prices in Germany, Bilzerian's task was to conduct an analysis for growing True Fruits internationally, which he was asked to prepare for the next board meeting. Of a short list of 32 potential markets, he had to identify the top three countries where the company should expand next (see Exhibit 8). Using the correct factors to identify these countries was critical, but Bilzerian had to consider another question: Was direct exporting the most efcient international mode of entry for True Fruits, or should the company consider using other methods such as licensing, anchising, joint ventures, or company-owned stores in certain markets? EXHIBIT 8: MARKET DATA TABLE (2016) Ease of Consumer Consumer Expenditure GDP per GDP Disposable Total Urban on Fruit and Vegetable Country Doing Population Business Capita (in $ Expenditure on Income per Population billions) Fruits per Juices per Capita Capita (in $) Ranking (in $) Capita (in $) (in $) (in '000) (in '000) Belarus 37 5,013.50 48 61.90 8.00 2,987.70 9,487.50 7,379.30 Belgium 42 41,348.90 466 194.80 180.50 23, 115.60 11,267.90 11,030.80 Bosnia- 81 16 84.70 3,554.50 3,816.20 2,004.70 Herzegovina 4,281.00 80.80 Bulgaria 39 7,285.60 52 46.00 86.70 4,126.50 7, 153.80 5,227.20 Croatia 43 12,004.40 50 137.70 89.30 7,658.30 4, 190.70 2,484.70 Czech Republic 27 18,342.10 194 135.00 89.10 9,481.90 10,553.20 7,727.30 Denmark 3 63,838.50 306 157.60 180.30 25,780.70 5,687.60 5,004.70 Estonia 12 18, 136.00 23 121.30 106.20 9,888.90 1,267.70 388.60 Finland 13 43, 124.90 237 280.50 194.10 24,565.20 5,487.30 4,629.00 France 29 38, 137.80 2,460 172.30 165.00 23,658.20 64,496.20 56,988.90 Georgia 16 3,810.90 14 23.30 14.30 2,643.90 3,720.40 2, 148.10 Greece 61 18,080.50 195 174.90 90.70 12,523.20 10,793.50 8,454.00 Hungary 41 12,673.50 125 69.40 105.10 6,566.20 9,830.50 6,929.80 Italy 50 30,406.70 1,854 227.20 126.70 19,709.60 60,986.80 42,556.50 Latvia 14 13,917.50 27 126.10 79.60 8,332.60 1,969.00 1,339.70 Lithuania 21 14,766.00 43 149.80 88.80 9,387.30 2,888.60 1,943.20 Macedonia 10 5,225.00 11 55.60 81.90 3,523.40 2,067.90 1,240.90 Montenegro 51 6,888.10 4 64.80 39.00 4,631.50 617.20 409.70 Netherlands 28 45,402.20 771 151.40 128.80 21,618.00 16,978.00 14,422.80 Norway 6 70,294.40 367 244.00 379.80 34,640.40 5,214.00 4,209.30 Poland 24 12,228.70 470 57.00 66.20 7,144.60 38,437.20 23, 166.40 Portugal 25 19,755.90 204 182.80 62.90 13,240.50 10,341.30 6,619.50 Romania 36 9,469.80 187 90.30 76.90 5,482.50 19,774.90 10,683.60EXHIBIT 8 (CONTINUED) Ease of Consumer Consumer Expenditure on Disposable Total Country Doing GDP per Capita GDP (in $ Expenditure on Urban Income per Business (in $) billions) Fruits per Fruit and Capita Population Population Ranking Capita (in $) Vegetable Juices (in $) (in '000) (in '000) per Capita (in $) Russia 40 8,627.00 1,244 116.20 80.20 4,778.90 144,218.20 107,290.30 Serbia 47 5,328.10 38 51.90 69.10 3,794.10 7,074.10 4,112.00 Slovakia 33 16,514.20 90 83.10 72.90 9,532.90 5,423.20 2,944.00 Slovenia 30 21,294.70 44 126.60 103.20 12,761.70 2,064.30 1,029.20 Spain 32 26,578.50 1,233 170.10 117.10 16,474.00 46,374.40 36,251.20 Sweden 51,833.80 511 210.60 197.70 25,055.80 9,851.00 8,468.30 Turkey 69 10,617.80 834 164.90 85.70 6,806.00 78,505.10 56,806.50 Ukraine 80 2,032.50 91 32.50 29.00 1,566.00 44,934.10 30,956.00 United 7 Kingdom 39,988.10 2,615 173.30 171.30 25,467.10 65,382.60 52,495.00 Note: GDP = gross domestic product. Source: Euromonitor International, "Countries Ordered A to Z," Passport, accessed March 4, 2017