Answered step by step
Verified Expert Solution
Link Copied!

Question

1 Approved Answer

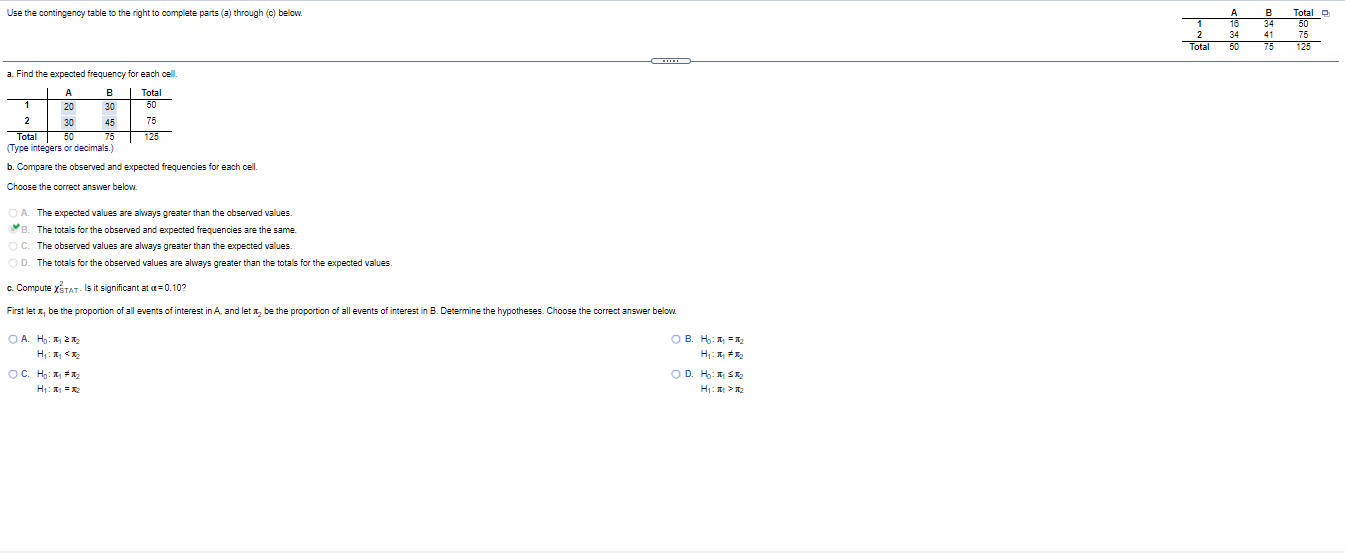
Question C Use the contingency table to the right to complete parts (a) through (c) below. Total IN - Total 3. Find the expected frequency

Question C

image text in transcribed
Use the contingency table to the right to complete parts (a) through (c) below. Total IN - Total 3. Find the expected frequency for each cell. A B Total 20 30 50 2 30 45 75 Total 50 125 (Type integers or decimals.) b. Compare the observed and expected frequencies for each cell. Choose the correct answer below. O A. The expected values are always greater than the observed values. B. The totals for the observed and expected frequencies are the same. O C. The observed values are always greater than the expected values. O D. The totals for the observed values are always greater than the totals for the expected values. c. Compute XSTAT - Is it significant at a= 0.10? First let x be the proportion of all events of interest in A, and let it be the proportion of all events of interest in B. Determine the hypotheses. Choose the correct answer below. OA. HI: 1 212 O B. HO: M = 12 OC. HO: 1 # 12 O D. Ho: M SEZ H1: 1 = 12 H1: M > 12

Step by Step Solution

There are 3 Steps involved in it

Step: 1

blur-text-image

Get Instant Access to Expert-Tailored Solutions

See step-by-step solutions with expert insights and AI powered tools for academic success

Step: 2

blur-text-image

Step: 3

blur-text-image

Ace Your Homework with AI

Get the answers you need in no time with our AI-driven, step-by-step assistance

Get Started

Recommended Textbook for

Maximum Principles And Geometric Applications

Authors: Luis J AlĂ­as, Paolo Mastrolia, Marco Rigoli

1st Edition

3319243373, 9783319243375

More Books

Students also viewed these Mathematics questions

Question

Using the same ad, explain what kind of appeal it uses?

Answered: 1 week ago