Answered step by step
Verified Expert Solution
Question
1 Approved Answer
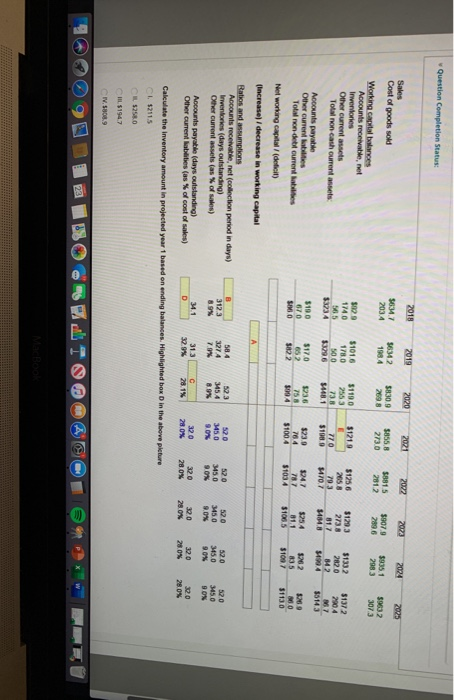
Question Completion Status: 2018 2019 2020 2021 2022 2023 2024 15347 2034 56342 1984 58309 5855.8 2730 58815 2812 30079 289.6 $935159532 28833073 Sales Cost
Step by Step Solution
There are 3 Steps involved in it
Step: 1

Get Instant Access to Expert-Tailored Solutions
See step-by-step solutions with expert insights and AI powered tools for academic success
Step: 2

Step: 3
Ace Your Homework with AI
Get the answers you need in no time with our AI-driven, step-by-step assistance
Get Started