Answered step by step
Verified Expert Solution
Link Copied!

Question

1 Approved Answer

Question Completion Status: A manufacturer of cylinder valves for GM has been sampling output from their process. So far, they have collected 20 samples of
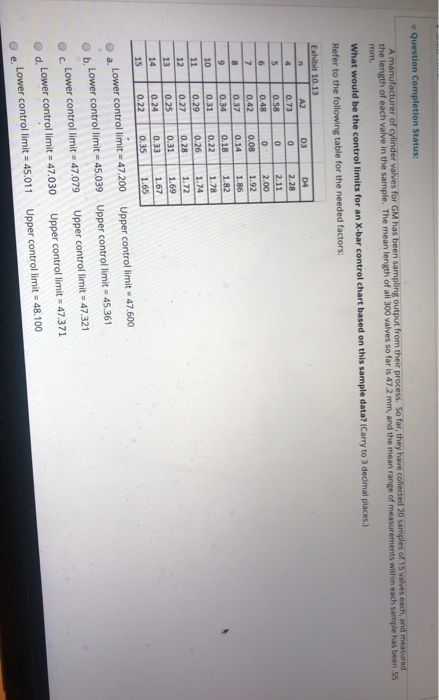
image text in transcribed
Question Completion Status: A manufacturer of cylinder valves for GM has been sampling output from their process. So far, they have collected 20 samples of 15 valves each, and measured the length of each valve in the sample. The mean length of all 300 valves so far is 47.2 mm, and the mean range of measurements within each sample has been 55 mm. What would be the control limits for an X-bar control chart based on this sample data? (Carry to 3 decimal places.) Refer to the following table for the needed factors: Exhibit 10.13 A2 D3 D4 10. 702,60 A2 03 0.48 11 0.29 0.26 130.250 Upper controllimit - 47.600 Lower controllimit = 47.200 Upper controllimit - 45.361 ob Lower controllimit = 45.039 Upper controllimit = 47.321 Lower controllimit - 47.079 Upper controllimit47.371 od Lower control limit=47.030 Upper controllimit - 48.100 Lower control limit= 45.011

Step by Step Solution

There are 3 Steps involved in it

Step: 1

blur-text-image

Get Instant Access to Expert-Tailored Solutions

See step-by-step solutions with expert insights and AI powered tools for academic success

Step: 2

blur-text-image_2

Step: 3

blur-text-image_3

Ace Your Homework with AI

Get the answers you need in no time with our AI-driven, step-by-step assistance

Get Started

Students also viewed these Finance questions