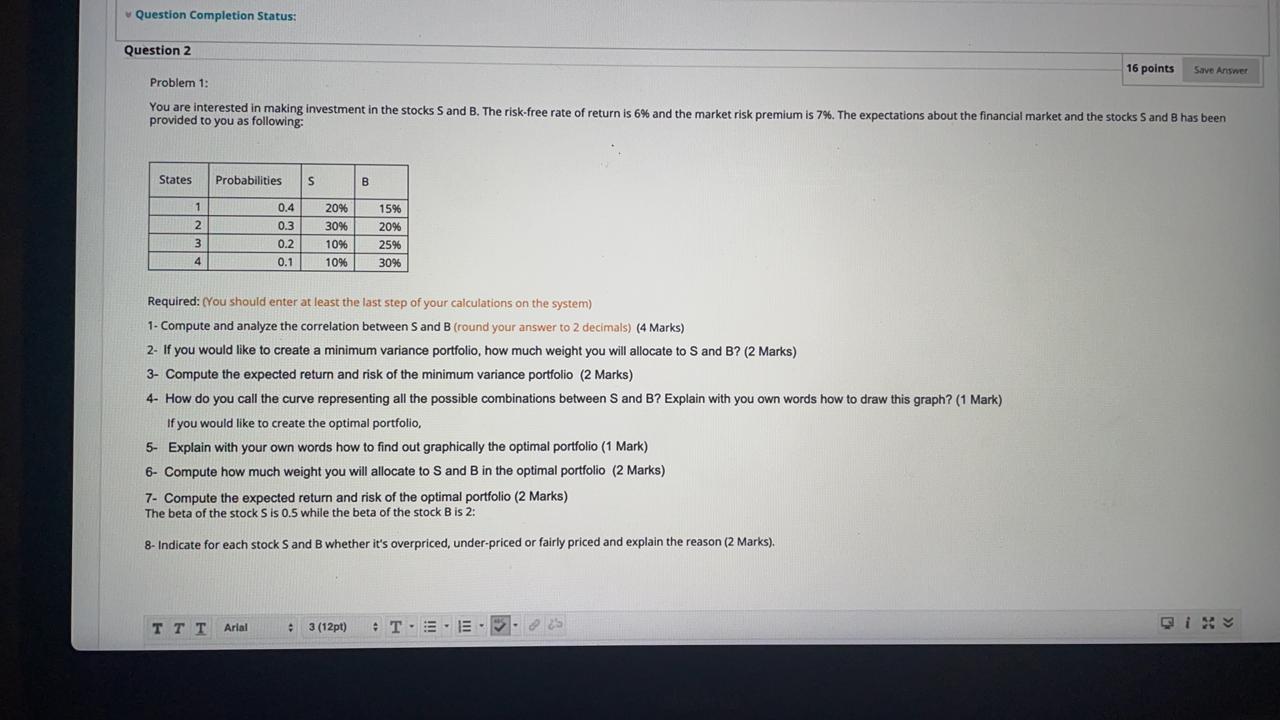
Question Completion Status: Question 2 16 points Save Answer Problem 1: You are interested in making investment in the stocks S and B. The risk-free rate of return is 6% and the market risk premium is 7%. The expectations about the financial market and the stocks S and B has been provided to you as following: States Probabilities S B 1 2096 2 3 0.4 0.3 0.2 30% 10% 1096 15% 20% 2596 30% 4 0.1 Required: (You should enter at least the last step of your calculations on the system) 1. Compute and analyze the correlation between S and B (round your answer to 2 decimals) (4 Marks) 2- If you would like to create a minimum variance portfolio, how much weight you will allocate to S and B? (2 Marks) 3- Compute the expected return and risk of the minimum variance portfolio (2 Marks) 4- How do you call the curve representing all the possible combinations between S and B? Explain with you own words how to draw this graph? (1 Mark) If you would like to create the optimal portfolio, 5- Explain with your own words how to find out graphically the optimal portfolio (1 Mark) 6- Compute how much weight you will allocate to S and B in the optimal portfolio (2 Marks) 7- Compute the expected return and risk of the optimal portfolio (2 Marks) The beta of the stock S is 0.5 while the beta of the stock Bis 2: 8- Indicate for each stock Sand B whether it's overpriced, under-priced or fairly priced and explain the reason (2 Marks). Arial 3 (12pt) T.E.E. Question Completion Status: Question 2 16 points Save Answer Problem 1: You are interested in making investment in the stocks S and B. The risk-free rate of return is 6% and the market risk premium is 7%. The expectations about the financial market and the stocks S and B has been provided to you as following: States Probabilities S B 1 2096 2 3 0.4 0.3 0.2 30% 10% 1096 15% 20% 2596 30% 4 0.1 Required: (You should enter at least the last step of your calculations on the system) 1. Compute and analyze the correlation between S and B (round your answer to 2 decimals) (4 Marks) 2- If you would like to create a minimum variance portfolio, how much weight you will allocate to S and B? (2 Marks) 3- Compute the expected return and risk of the minimum variance portfolio (2 Marks) 4- How do you call the curve representing all the possible combinations between S and B? Explain with you own words how to draw this graph? (1 Mark) If you would like to create the optimal portfolio, 5- Explain with your own words how to find out graphically the optimal portfolio (1 Mark) 6- Compute how much weight you will allocate to S and B in the optimal portfolio (2 Marks) 7- Compute the expected return and risk of the optimal portfolio (2 Marks) The beta of the stock S is 0.5 while the beta of the stock Bis 2: 8- Indicate for each stock Sand B whether it's overpriced, under-priced or fairly priced and explain the reason (2 Marks). Arial 3 (12pt) T.E.E