Question: create a short professional report for the followings Valuation: Calculating Net Tangible Assets (NTA) or Net Asset Value (NAV). REITPricing through premium/discount to NTA for the company called Dexus (between 200words to 600words)
use the graph below to write an analysis report
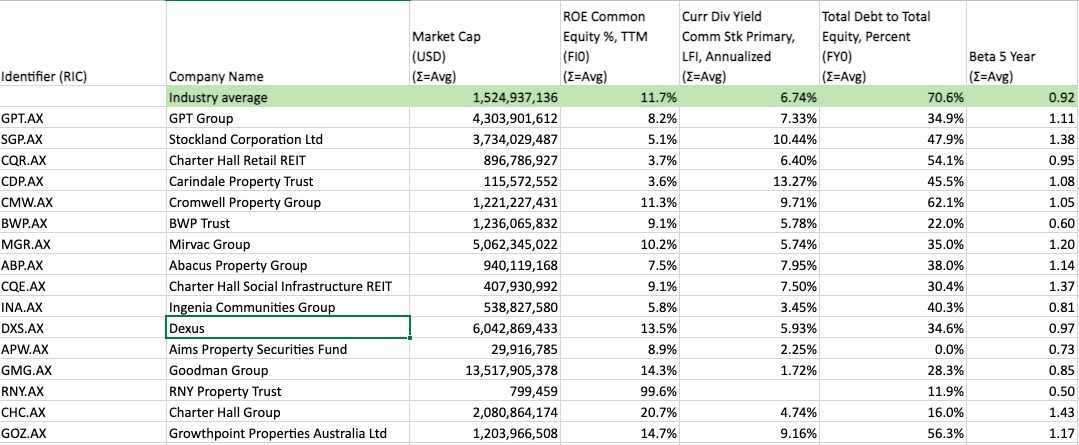
Identifier (RIC) GPT.AX SGP.AX CQR.AX CDP.AX CMW.AX BWP.AX MGR.AX ABP.AX CQE.AX INA.AX DXS.AX APW.AX GMG.AX RNY.AX CHC.AX GOZ.AX Company Name Industry average GPT Group Stockland Corporation Ltd Charter Hall Retail REIT Carindale Property Trust Cromwell Property Group BWP Trust Mirvac Group Abacus Property Group Charter Hall Social Infrastructure REIT Ingenia Communities Group Dexus Aims Property Securities Fund Goodman Group RNY Property Trust Charter Hall Group Growthpoint Properties Australia Ltd Market Cap (USD) (=Avg) 1,524,937,136 4,303,901,612 3,734,029,487 896,786,927 115,572,552 1,221,227,431 1,236,065,832 5,062,345,022 940,119,168 407,930,992 538,827,580 6,042,869,433 29,916,785 13,517,905,378 799,459 2,080,864,174 1,203,966,508 ROE Common Equity %, TTM (FIO) (=Avg) 11.7% 8.2% 5.1% 3.7% 3.6% 11.3% 9.1% 10.2% 7.5% 9.1% 5.8% 13.5% 8.9% 14.3% 99.6% 20.7% 14.7% Curr Div Yield Comm Stk Primary, LFI, Annualized (E=Avg) 6.74% 7.33% 10.44% 6.40% 13.27% 9.71% 5.78% 5.74% 7.95% 7.50% 3.45% 5.93% 2.25% 1.72% 4.74% 9.16% Total Debt to Total Equity, Percent (FYO) (Z=Avg) 70.6% 34.9% 47.9% 54.1% 45.5% 62.1% 22.0% 35.0% 38.0% 30.4% 40.3% 34.6% 0.0% 28.3% 11.9% 16.0% 56.3% Beta 5 Year (Z=Avg) 0.92 1.11 1.38 0.95 1.08 1.05 0.60 1.20 1.14 1.37 0.81 0.97 0.73 0.85 0.50 1.43 1.17 Identifier (RIC) GPT.AX SGP.AX CQR.AX CDP.AX CMW.AX BWP.AX MGR.AX ABP.AX CQE.AX INA.AX DXS.AX APW.AX GMG.AX RNY.AX CHC.AX GOZ.AX Company Name Industry average GPT Group Stockland Corporation Ltd Charter Hall Retail REIT Carindale Property Trust Cromwell Property Group BWP Trust Mirvac Group Abacus Property Group Charter Hall Social Infrastructure REIT Ingenia Communities Group Dexus Aims Property Securities Fund Goodman Group RNY Property Trust Charter Hall Group Growthpoint Properties Australia Ltd Market Cap (USD) (=Avg) 1,524,937,136 4,303,901,612 3,734,029,487 896,786,927 115,572,552 1,221,227,431 1,236,065,832 5,062,345,022 940,119,168 407,930,992 538,827,580 6,042,869,433 29,916,785 13,517,905,378 799,459 2,080,864,174 1,203,966,508 ROE Common Equity %, TTM (FIO) (=Avg) 11.7% 8.2% 5.1% 3.7% 3.6% 11.3% 9.1% 10.2% 7.5% 9.1% 5.8% 13.5% 8.9% 14.3% 99.6% 20.7% 14.7% Curr Div Yield Comm Stk Primary, LFI, Annualized (E=Avg) 6.74% 7.33% 10.44% 6.40% 13.27% 9.71% 5.78% 5.74% 7.95% 7.50% 3.45% 5.93% 2.25% 1.72% 4.74% 9.16% Total Debt to Total Equity, Percent (FYO) (Z=Avg) 70.6% 34.9% 47.9% 54.1% 45.5% 62.1% 22.0% 35.0% 38.0% 30.4% 40.3% 34.6% 0.0% 28.3% 11.9% 16.0% 56.3% Beta 5 Year (Z=Avg) 0.92 1.11 1.38 0.95 1.08 1.05 0.60 1.20 1.14 1.37 0.81 0.97 0.73 0.85 0.50 1.43 1.17