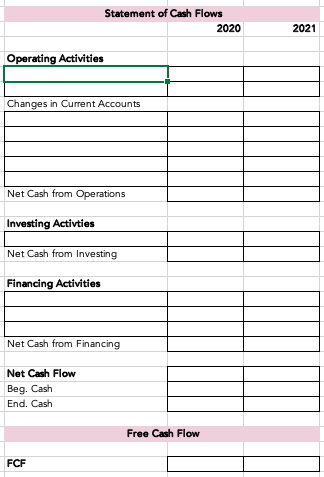
Question: Create Statements of Cash Flow for 2020 and 2021 using the indirect method.
- How do I fill out the Statements of Cash Flow for years 2020 and 2021 with the given data using the indirect method?
Question: Compute Free Cash Flow for 2020 and 2021.
- What numbers would I use to compute Free Cash Flow for years 2020 and 2021?
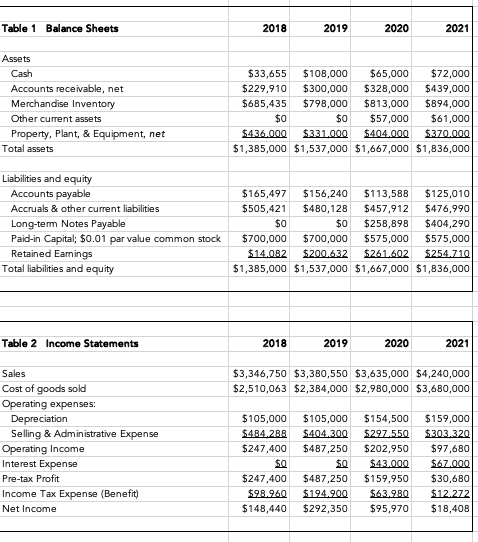
Info. You begin by analyzing the firms financials over the last four years, which are presented in the supplemental datasheet. As part of your discovery process, you collect some industry metrics (see datasheet). You also learn that the company sold no property, plant, or equipment during the time periods presented. The company repurchased 12,500 shares of common stock on Jan 1, 2021 at $10/share. And finally, the companys normal credit terms extended to its customers are net 20.


Statement of Cash Flows 20202021 Operating Activities \begin{tabular}{|l|l|l|} \hline & & \\ \hline & & \\ \hline \end{tabular} Changes in Current Accounts \begin{tabular}{|l|l|l|} \hline & & \\ \hline & & \\ \hline & & \\ \hline & & \\ \hline & & \\ \hline Net Cash from Operations & & \\ \cline { 2 - 4 } & & \\ \hline \end{tabular} Investing Activties \begin{tabular}{|l|l|l|} \hline & & \\ \hline Net Cash from Investing & & \\ \cline { 2 - 3 } & & \end{tabular} Financing Activities Net Cash Flow Beg. Cash End. Cash \begin{tabular}{|l|l|} \hline & \\ \hline & \\ \hline & \\ \hline \end{tabular} Free Cash Flow FCF Table 1 Balance Sheets \begin{tabular}{|l|l|l|l|} \hline 2018 & 2019 & 2020 & 2021 \\ \hline \end{tabular} Assets \begin{tabular}{|l|r|r|r|r|} \hline Cash & $33,655 & $108,000 & $65,000 & $72,000 \\ \hline Accounts receivable, net & $229,910 & $300,000 & $328,000 & $439,000 \\ \hline Merchandise Inventory & $685,435 & $798,000 & $813,000 & $894,000 \\ \hline Other current assets & $0 & $0 & $57,000 & $61,000 \\ \hline Property, Plant, \& Equipment, net & $4,36,000 & $331,000 & $404,000 & $370,000 \\ \hline Total assets & $1,385,000 & $1,537,000 & $1,667,000 & $1,836,000 \\ \hline & & & & \\ \hline Liabilities and equity & $165,497 & $156,240 & $113,588 & $125,010 \\ \hline Accounts payable & $505,421 & $480,128 & $457,912 & $476,990 \\ \hline Accruals \& other current liabilities & $0 & $0 & $258,898 & $404,290 \\ \hline Long-term Notes Payable & $700,000 & $700,000 & $575,000 & $575,000 \\ \hline Paid-in Capital; $0.01 par value common stock & $14,082 & $200,632 & $261,602 & $254,710 \\ \hline Retained Earnings & $1,385,000 & $1,537,000 & $1,667,000 & $1,836,000 \\ \hline Total liabilities and equity & & & & \\ \hline \end{tabular} Table 2 Income Statements Sales Cost of goods sold \begin{tabular}{|l|l|l|l|} \hline$3,346,750 & $3,380,550 & $3,635,000 & $4,240,000 \\ \hline$2,510,063 & $2,384,000 & $2,980,000 & $3,680,000 \\ \hline \end{tabular} Operating expenses: \begin{tabular}{|l|r|r|r|r|} \hline Depreciation & $105,000 & $105,000 & $154,500 & $159,000 \\ \hline Selling \& Administrative Expense & $484,288 & $404,300 & $297,550 & $303,320 \\ \hline Operating Income & $247,400 & $487,250 & $202,950 & $97,680 \\ \hline Interest Expense & $0 & $0 & $4,000 & $67,000 \\ \hline Pre-tax Profit & $247,400 & $487,250 & $159,950 & $30,680 \\ \hline Income Tax Expense (Benefit) & $98,960 & $194,900 & $63,980 & $12,272 \\ \hline Net Income & $148,440 & $292,350 & $95,970 & $18,408 \\ \hline \end{tabular} Table 3 Other Information \begin{tabular}{|l|r|r|r|r|} \hline Dividends Paid & $68,000 & $105,800 & $35,000 & $25,300 \\ \hline Year end Stock price & $12.80 & $10.50 & $6.00 & $3.50 \\ \hline Avg. Shares outstanding & 112,500 & 112,500 & 100,000 & 100,000 \\ \hline Effective Tax Rate & 40.00% & 40.00% & 40.00% & 40.00% \\ \hline Sales of Property, Plant, \& Equipment & $0 & $0 & $0 & $0 \\ \hline \end{tabular}


