

Answered step by step
Verified Expert Solution
Question
1 Approved Answer
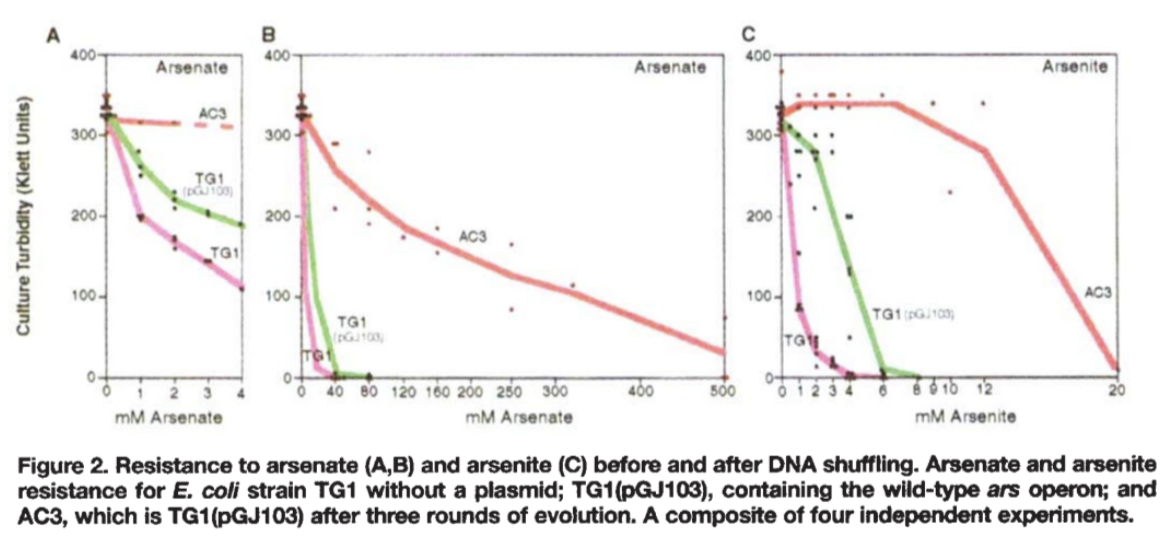
Question: Explain the figure 2. below in detail. Figure from this article Molecular evolution of an arsenate detoxification pathway by DNA shuffling (Crameri, 1997). A
Question: Explain the figure 2. below in detail. Figure from this article "Molecular evolution of an arsenate detoxification pathway by DNA shuffling" (Crameri, 1997).
Step by Step Solution
There are 3 Steps involved in it
Step: 1

Get Instant Access to Expert-Tailored Solutions
See step-by-step solutions with expert insights and AI powered tools for academic success
Step: 2

Step: 3
Ace Your Homework with AI
Get the answers you need in no time with our AI-driven, step-by-step assistance
Get Started
Surfactant Formulation Engineering Using HLD And NAC
Authors: Edgar Acosta, Jeffrey Harwell, David A. Sabatini
1st Edition
0128214813, 978-0128214817