Answered step by step
Verified Expert Solution
Question
1 Approved Answer
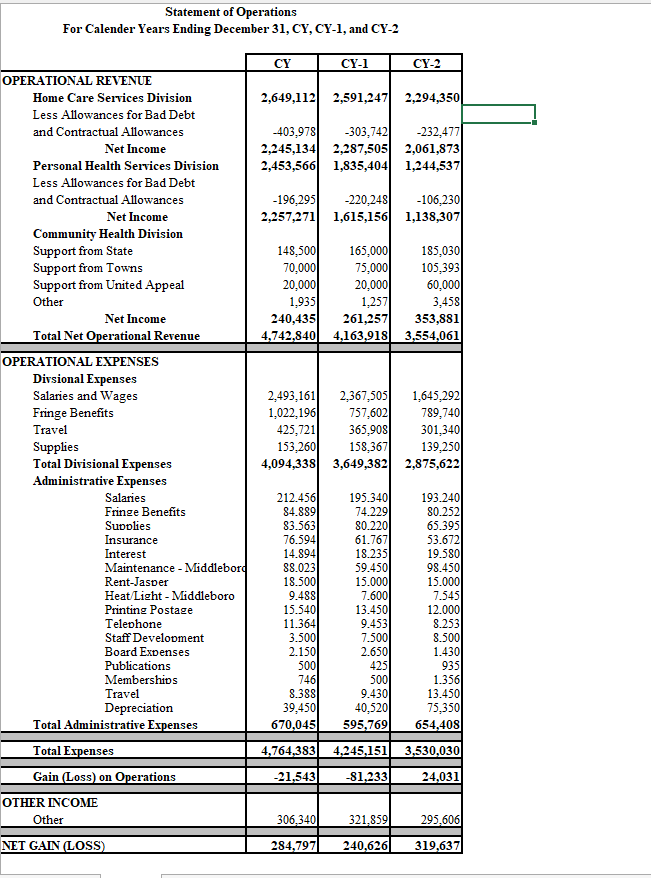
Question: Financial Issues- HILLSBORO COUNTY HOME HEALTH AGENCY, INC Medicare and Medicaid cover the s... Financial Issues- HILLSBORO COUNTY HOME HEALTH AGENCY, INC Medicare and
Question: Financial Issues- HILLSBORO COUNTY HOME HEALTH AGENCY, INC Medicare and Medicaid cover the s...
- Financial Issues- HILLSBORO COUNTY HOME HEALTH AGENCY, INC
- Medicare and Medicaid cover the services provided by the Home Care Services Division. Both pay the agency on a prospective basis, with no retrospective settlement. For Medicare, the prospective payment is based on the scoring attributed to the acuity level of the patient at a rate determined by federal guidelines. For Medicaid the prospective payment is based on a state wide determined rate per service. When services are rendered to individuals not covered by Medicare or Medicaid, bills are issued either directly to the patient or to the patients commercial insurance carrier.
- The Personal Health Services Division issues a bill for all services rendered. Medicare does not cover any service provided by this division. Medicaid covers select services that must be pre approved and has a fee schedule for specific services. Most of the revenue earned in this division is from self-pay and commercial insurance.

- The Community Health Division finances its services based upon grants from the state or local agencies. Some towns also provide support as a line item in the towns budget. Modest users fees are solicited when appropriate.
- Each division is managed as a distinct financial entity and is allocated a portion of the overall agencys general and administrative costs. Managers prepare budgets approximately six months prior to implementation; all proposed the Finance Committee based upon recommendation of the Executive Director reviews budgets. The Finance Committee also oversees budget implementation and examines all significant budget variances.
- The agency maintains a master price list for all services based upon Relative Value Units (RVUs). RVUs per service are based upon the length of time typically required to provide the service and the wage and benefit expense of the workers who provide the services. Variable costs and a portion of all fixed costs are also allocated to determine these prices per RVU and by service. This approach allows the agency to estimate and budget expenses and revenue based upon RVUs. ****NEED TO WRITE AN EXECUTIVE SUMMARY TO ADDRESS FINANCIAL ISSUES with snapshot of future forecasts and recommendations please
Step by Step Solution
There are 3 Steps involved in it
Step: 1

Get Instant Access to Expert-Tailored Solutions
See step-by-step solutions with expert insights and AI powered tools for academic success
Step: 2

Step: 3

Ace Your Homework with AI
Get the answers you need in no time with our AI-driven, step-by-step assistance
Get Started


