

Question: a. b. A graph of position versus time for a certain particle moving along the x-axis is shown in Figure I below. Find the
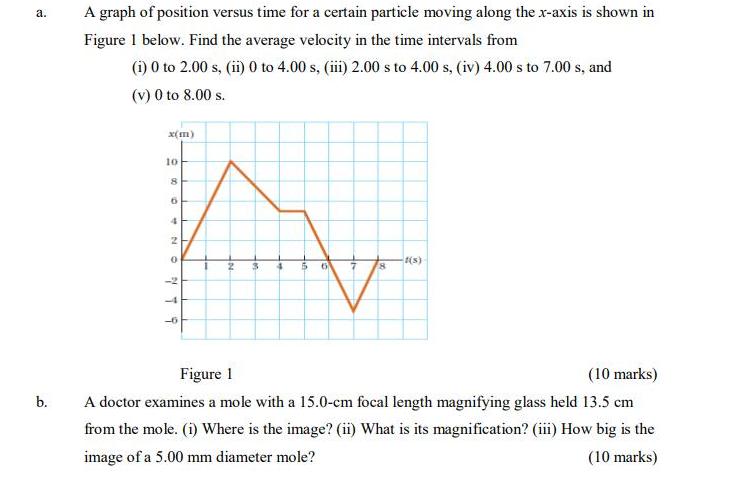
a. b. A graph of position versus time for a certain particle moving along the x-axis is shown in Figure I below. Find the average velocity in the time intervals from (i) 0 to 2.00 s, (ii) 0 to 4.00 s, (iii) 2.00 s to 4.00 s, (iv) 4.00 s to 7.00 s, and (v) 0 to 8.00 s. x(m) 10 8 6 4 NO 2 2 79 5 6 8 t(s) Figure 1 (10 marks) A doctor examines a mole with a 15.0-cm focal length magnifying glass held 13.5 cm from the mole. (i) Where is the image? (ii) What is its magnification? (iii) How big is the image of a 5.00 mm diameter mole? (10 marks)
Step by Step Solution
3.58 Rating (158 Votes )
There are 3 Steps involved in it

Get step-by-step solutions from verified subject matter experts