Question from capstone simulation 

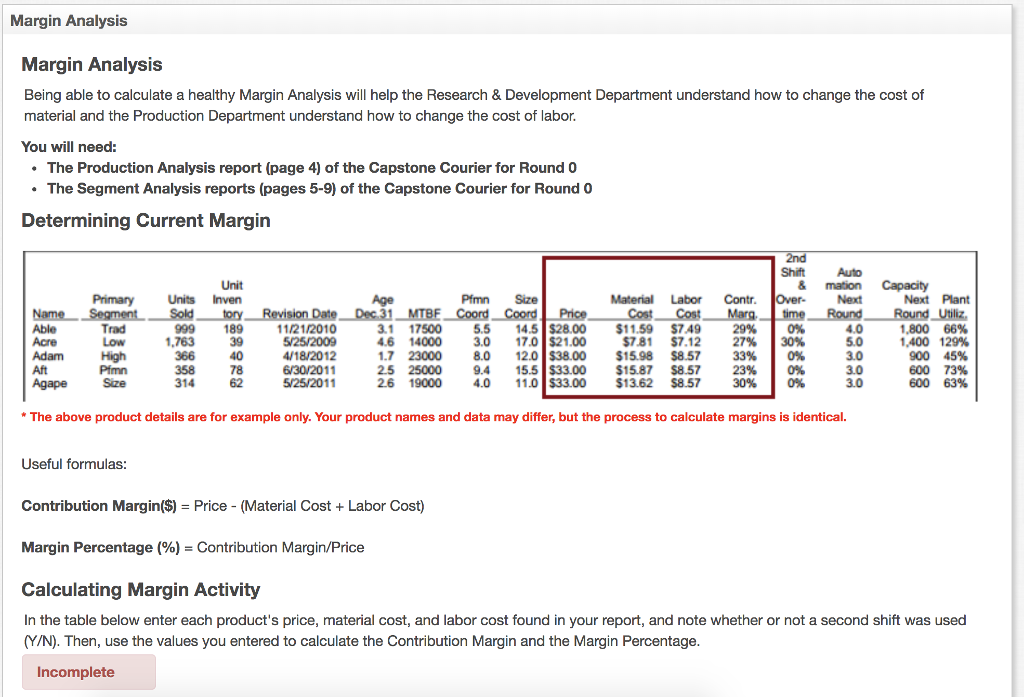
Margin Analysis Margin Analysis Being able to calculate a healthy Margin Analysis will help the Research & Development Department understand how to change the cost of material and the Production Department understand how to change the cost of labor You will need: . The Production Analysis report (page 4) of the Capstone Courier for Round 0 The Segment Analysis reports (pages 5-9) of the Capstone Courier for Round 0 Determining Current Margin Shift Auto & mation Capacity Unit PrimaryUnits Inven Pfmn Size Material Labor Cont. Over- Next Plant MTBE Coord Coord Price 1 17500 6 14000 3.0 29% 27% 0% 30% Able Acre Adam Aft Agape Size Trad 999 189 1/21/2010 5.5 14.5 $28.00 $11.59 $7.49 4.0 5.0 3.0 3.0 3.0 1,800 66% 1.400 129% 900 45% 600 73% 600 63% 1,763 17.0 $21.00 $7.81 $7.12 40 78 62 4/18/2012 6/30/2011 5/25/2011 1.7 23000 8.0 12.0 $38.00 $15.98 $8.57 33% 0% 9.4 15.5 $33.00 $15.87 $8.57 26 19000 4.0 11.0 $33.00 $13.62 $8.57 30% 0% 358 314 2.5 25000 23% 0% The above product details are for example only. Your product names and data may differ, but the process to calculate margins is identical. Useful formulas Contribution Margin($) Price (Material Cost Labor Cost) Margin Percentage (%)-Contribution Margin/Price Calculating Margin Activity In the table below enter each product's price, material cost, and labor cost found in your report, and note whether or not a second shift was used (Y/N). Then, use the values you entered to calculate the Contribution Margin and the Margin Percentage Incomplete Margin Analysis Margin Analysis Being able to calculate a healthy Margin Analysis will help the Research & Development Department understand how to change the cost of material and the Production Department understand how to change the cost of labor You will need: . The Production Analysis report (page 4) of the Capstone Courier for Round 0 The Segment Analysis reports (pages 5-9) of the Capstone Courier for Round 0 Determining Current Margin Shift Auto & mation Capacity Unit PrimaryUnits Inven Pfmn Size Material Labor Cont. Over- Next Plant MTBE Coord Coord Price 1 17500 6 14000 3.0 29% 27% 0% 30% Able Acre Adam Aft Agape Size Trad 999 189 1/21/2010 5.5 14.5 $28.00 $11.59 $7.49 4.0 5.0 3.0 3.0 3.0 1,800 66% 1.400 129% 900 45% 600 73% 600 63% 1,763 17.0 $21.00 $7.81 $7.12 40 78 62 4/18/2012 6/30/2011 5/25/2011 1.7 23000 8.0 12.0 $38.00 $15.98 $8.57 33% 0% 9.4 15.5 $33.00 $15.87 $8.57 26 19000 4.0 11.0 $33.00 $13.62 $8.57 30% 0% 358 314 2.5 25000 23% 0% The above product details are for example only. Your product names and data may differ, but the process to calculate margins is identical. Useful formulas Contribution Margin($) Price (Material Cost Labor Cost) Margin Percentage (%)-Contribution Margin/Price Calculating Margin Activity In the table below enter each product's price, material cost, and labor cost found in your report, and note whether or not a second shift was used (Y/N). Then, use the values you entered to calculate the Contribution Margin and the Margin Percentage Incomplete


