

Answered step by step
Verified Expert Solution
Question
1 Approved Answer
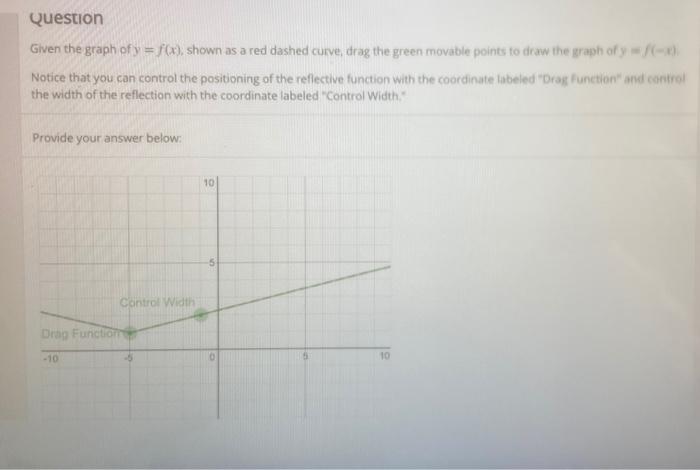
Question Given the graph of y = f() shown as a red dashed curve, drag the green movable points to draw the graph of y
Step by Step Solution
There are 3 Steps involved in it
Step: 1

Get Instant Access to Expert-Tailored Solutions
See step-by-step solutions with expert insights and AI powered tools for academic success
Step: 2

Step: 3
Ace Your Homework with AI
Get the answers you need in no time with our AI-driven, step-by-step assistance
Get Started
The Well Church Book A Practical Guide To Mission Audit
Authors: John Finney
1st Edition
0862015499, 978-0862015497