

Answered step by step
Verified Expert Solution
Question
1 Approved Answer
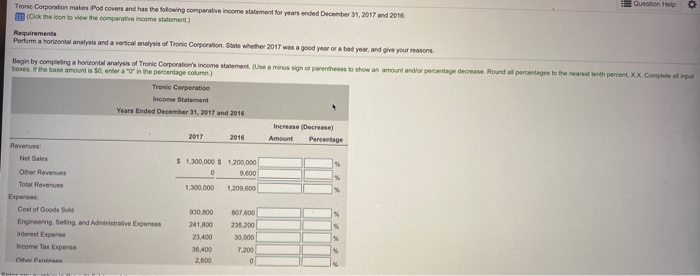
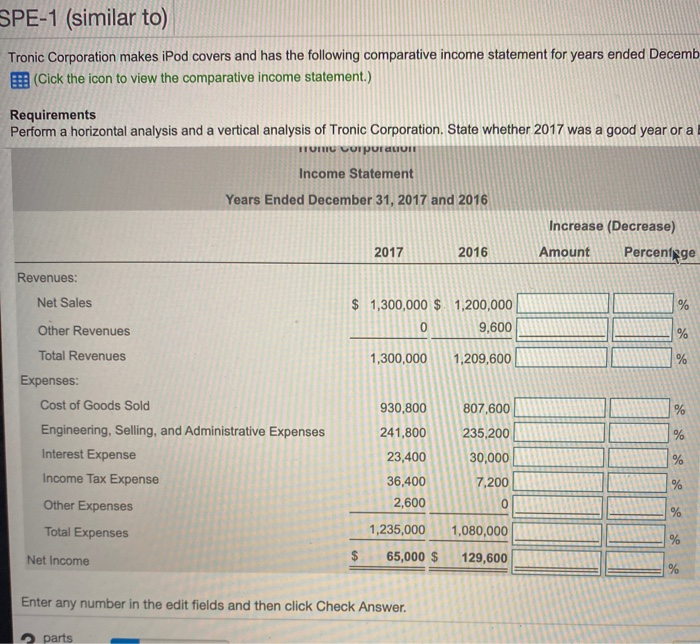
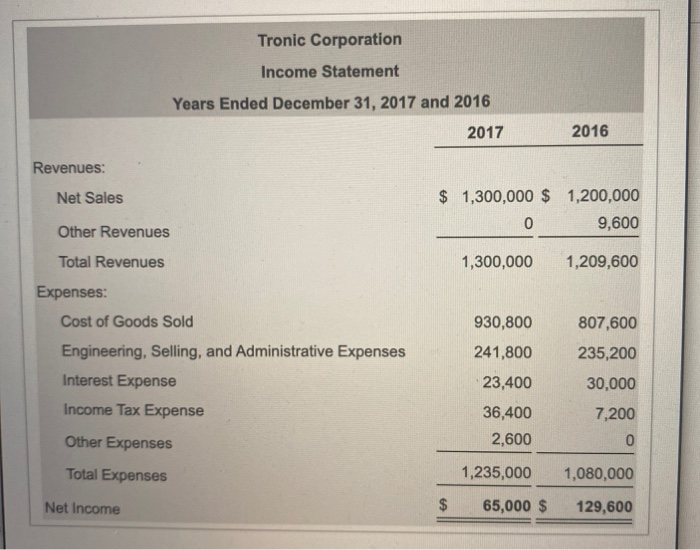
Question Help 0 Tronic Corporation makes iPod covers and has the flowing comparative income statement for years ended December 31, 2017 and 2016 mick the
Step by Step Solution
There are 3 Steps involved in it
Step: 1

Get Instant Access to Expert-Tailored Solutions
See step-by-step solutions with expert insights and AI powered tools for academic success
Step: 2

Step: 3
Ace Your Homework with AI
Get the answers you need in no time with our AI-driven, step-by-step assistance
Get Started
No Nonsense Employee Retention Audit
Authors: Jeff Kortes
1st Edition
0988307014, 978-0988307018