

Answered step by step
Verified Expert Solution
Question
1 Approved Answer
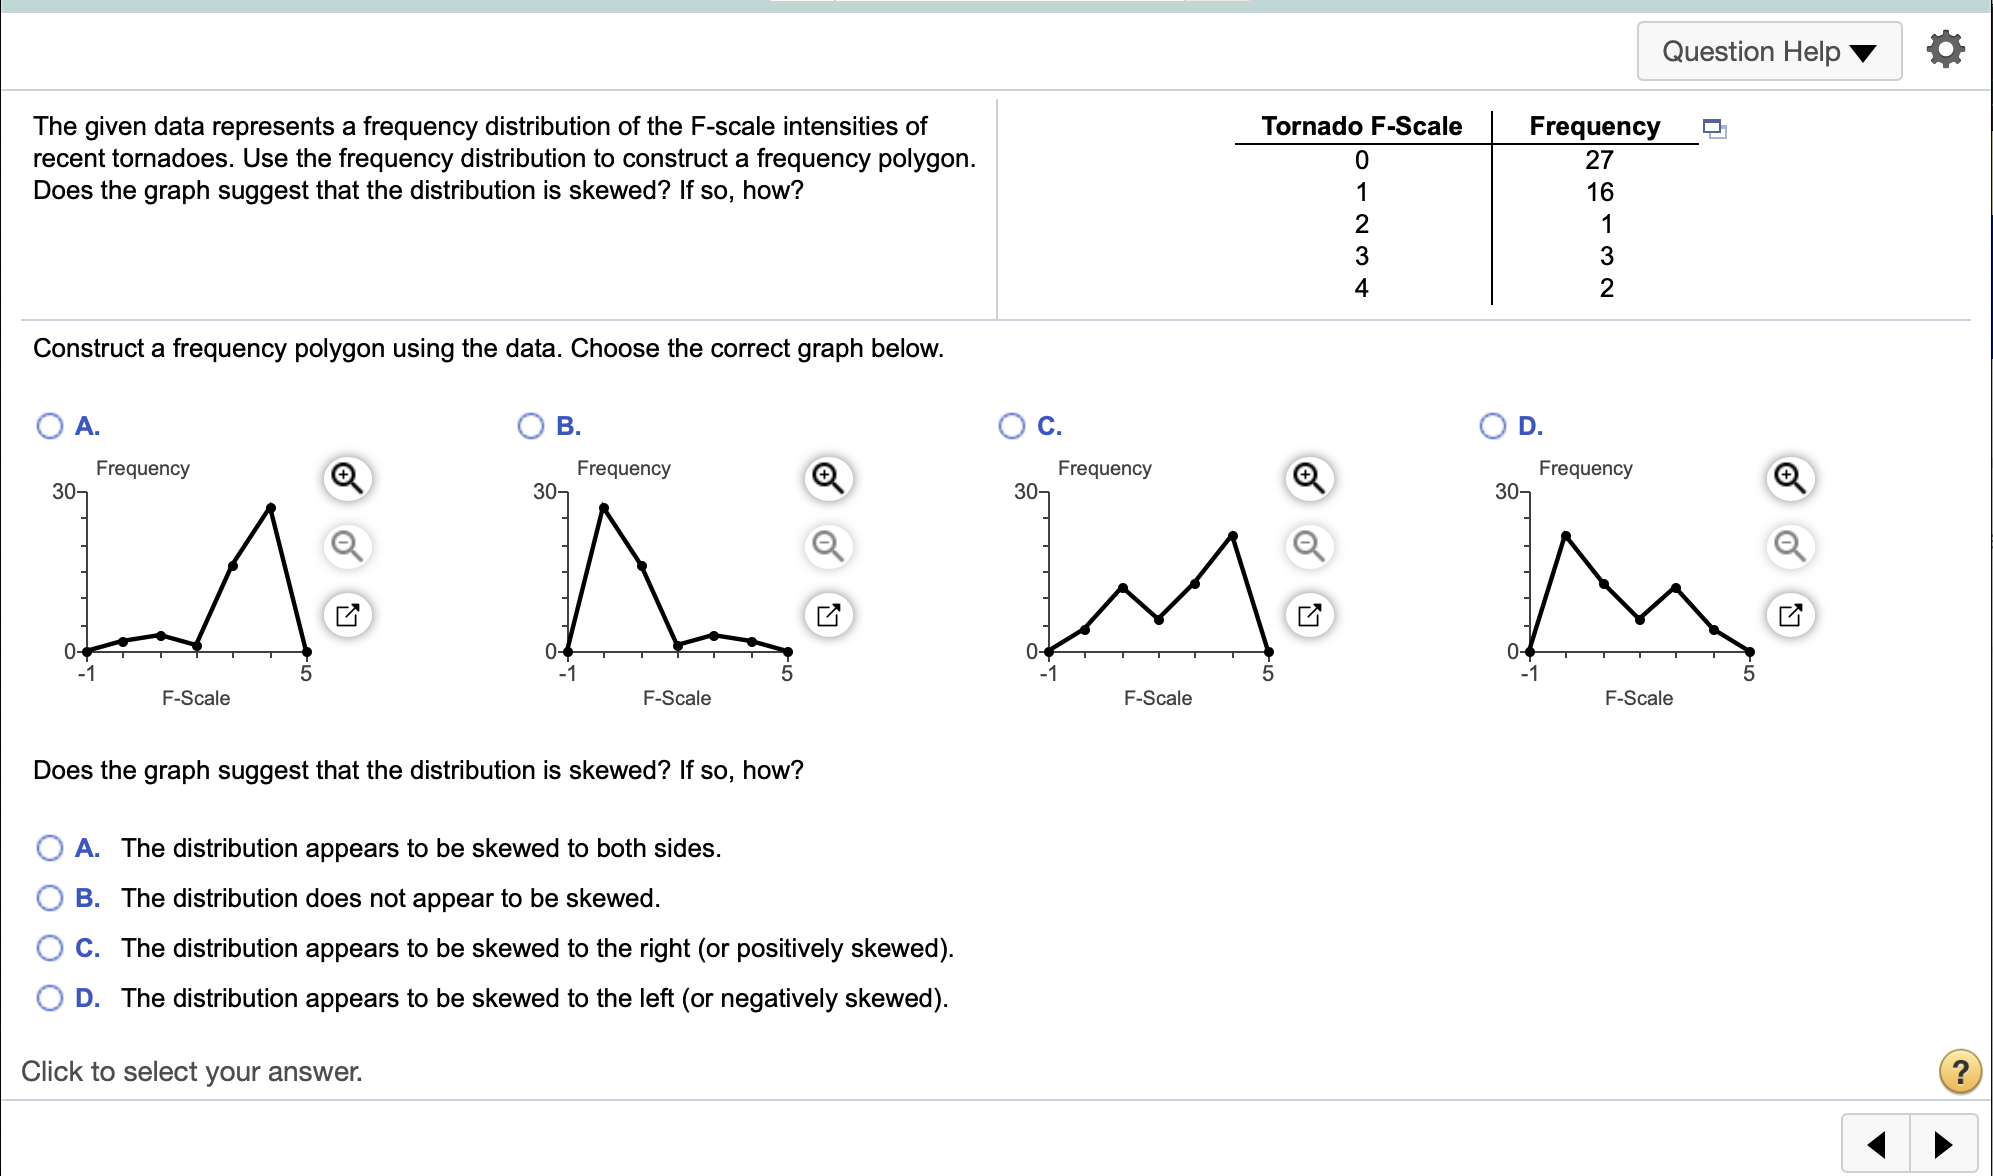
Question Help V 'a The given data represents a frequency distribution of the F-scale intensities of Tornado F-Scale Frequency % recent tornadoes. Use the frequency
Step by Step Solution
There are 3 Steps involved in it
Step: 1

Get Instant Access to Expert-Tailored Solutions
See step-by-step solutions with expert insights and AI powered tools for academic success
Step: 2

Step: 3
Ace Your Homework with AI
Get the answers you need in no time with our AI-driven, step-by-step assistance
Get Started