Answered step by step
Verified Expert Solution
Link Copied!

Question

1 Approved Answer

Question: I can not understand the meaning of following discription, explain it with graphs(I can not imagine a graph.) This assumption may be checked visually

Question:

I can not understand the meaning of following discription, explain it with graphs(I can not imagine a graph.)

This assumption may be checked visually by plotting y = residuals versus x = fitted (estimated expected) values. Constant variance will show up if the graph forms a fairly level band across the page. A scatterplot of residuals versus fitted values can be produced in R using the plot function applied to the fitted values (as the first argument to the function) and residuals (as the second argument) for an aov object.

If, for example, the variability of the group's data is larger for groups with larger means (as happens with lots of biological data), this will appear on the graph as a widening of the band towards the right. In this case a log transformation of the data is indicated. (We will use the natural log, to base e.) The observed values y are all replaced by log(y), the ANOVA is done again, and the diagnostic graphs for checking normality and constant variance are again plotted. A comparison of these diagnostic graphs with those for the raw data will help indicate if log data should be used in the final analysis.
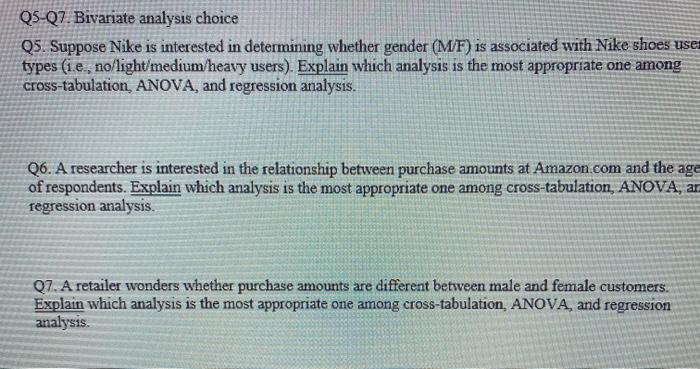
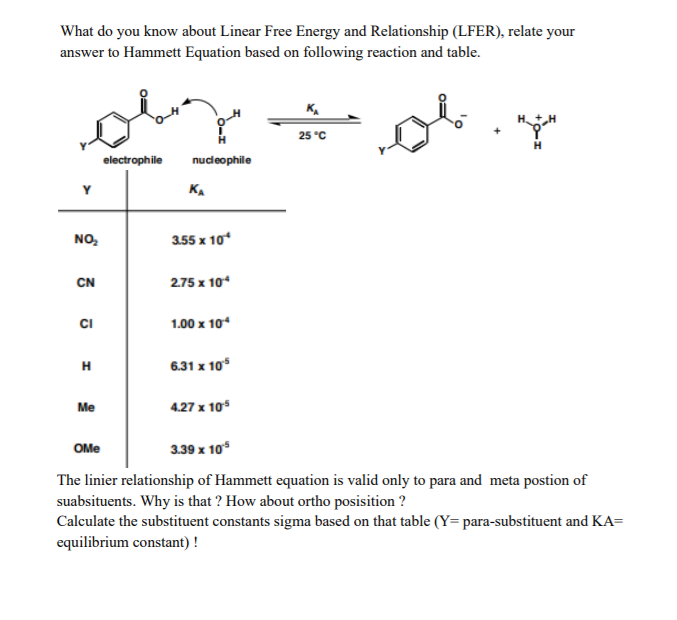
image text in transcribedimage text in transcribed
Q5-Q7. Bivariate analysis choice Q5. Suppose Nike is interested in determining whether gender (M/F) is associated with Nike shoes use types (i.e., no/light/medium/heavy users). Explain which analysis is the most appropriate one among cross-tabulation, ANOVA, and regression analysis. Q6. A researcher is interested in the relationship between purchase amounts at Amazon.com and the age of respondents. Explain which analysis is the most appropriate one among cross-tabulation, ANOVA, ar regression analysis. Q7. A retailer wonders whether purchase amounts are different between male and female customers. Explain which analysis is the most appropriate one among cross-tabulation, ANOVA, and regression analysis.What do you know about Linear Free Energy and Relationship (LFER), relate your answer to Hammett Equation based on following reaction and table. H I 25 "C electrophile nucleophile Y KA NO. 3.55 x 10* CN 2.75 x 10* CI 1.00 x 10* H 6.31 x 10 Me 4.27 x 10'S OMe 3.39 x 10'5 The linier relationship of Hammett equation is valid only to para and meta postion of suabsituents. Why is that ? How about ortho posisition ? Calculate the substituent constants sigma based on that table (Y= para-substituent and KA= equilibrium constant)

Step by Step Solution

There are 3 Steps involved in it

Step: 1

blur-text-image

Get Instant Access to Expert-Tailored Solutions

See step-by-step solutions with expert insights and AI powered tools for academic success

Step: 2

blur-text-image

Step: 3

blur-text-image

Ace Your Homework with AI

Get the answers you need in no time with our AI-driven, step-by-step assistance

Get Started

Recommended Textbook for

Trigonometry

Authors: Cynthia Y Young

5th Edition

1119820928, 9781119820925

More Books

Students also viewed these Mathematics questions

Question

Determine the amplitude and period of each function.

Answered: 1 week ago

Question

1. Define the nature of interviews

Answered: 1 week ago

Question

2. Outline the different types of interviews

Answered: 1 week ago