Answered step by step
Verified Expert Solution
Link Copied!

Question

1 Approved Answer

Question I [total: 10 points) Consider the following economy, which is the same economy as the one presented in class: Aggregate Expenditure E, = C,
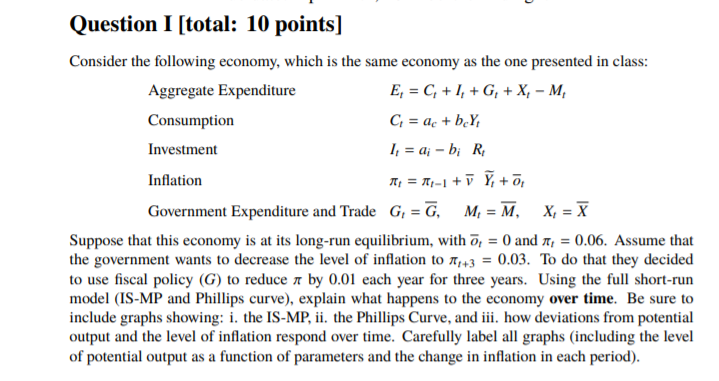
image text in transcribed

Question I [total: 10 points) Consider the following economy, which is the same economy as the one presented in class: Aggregate Expenditure E, = C, +1, + G, + X, - M, Consumption C = a + bcY, Investment 1. = a; -; R. Inflation x = -1 + , +5, Government Expenditure and Trade G = G, M = M, X, = X Suppose that this economy is at its long-run equilibrium, with , = 0 and 11 = 0.06. Assume that the government wants to decrease the level of inflation to 71+3 = 0.03. To do that they decided to use fiscal policy (G) to reduce a by 0.01 each year for three years. Using the full short-run model (IS-MP and Phillips curve), explain what happens to the economy over time. Be sure to include graphs showing: i. the IS-MP, ii. the Phillips Curve, and iii. how deviations from potential output and the level of inflation respond over time. Carefully label all graphs (including the level of potential output as a function of parameters and the change in inflation in each period). Question I [total: 10 points) Consider the following economy, which is the same economy as the one presented in class: Aggregate Expenditure E, = C, +1, + G, + X, - M, Consumption C = a + bcY, Investment 1. = a; -; R. Inflation x = -1 + , +5, Government Expenditure and Trade G = G, M = M, X, = X Suppose that this economy is at its long-run equilibrium, with , = 0 and 11 = 0.06. Assume that the government wants to decrease the level of inflation to 71+3 = 0.03. To do that they decided to use fiscal policy (G) to reduce a by 0.01 each year for three years. Using the full short-run model (IS-MP and Phillips curve), explain what happens to the economy over time. Be sure to include graphs showing: i. the IS-MP, ii. the Phillips Curve, and iii. how deviations from potential output and the level of inflation respond over time. Carefully label all graphs (including the level of potential output as a function of parameters and the change in inflation in each period)

Step by Step Solution

There are 3 Steps involved in it

Step: 1

blur-text-image

Get Instant Access to Expert-Tailored Solutions

See step-by-step solutions with expert insights and AI powered tools for academic success

Step: 2

blur-text-image

Step: 3

blur-text-image

Ace Your Homework with AI

Get the answers you need in no time with our AI-driven, step-by-step assistance

Get Started

Recommended Textbook for

Retail Industry IRS Audit Technique Guide

Authors: Internal Revenue Service

1st Edition

1304114783, 978-1304114785

More Books

Students also viewed these Accounting questions